

U.S. Auto Sales Brand-by-Brand Results: October 2017 YTD

It was only a mere blip, the year-over-year increase reported by the U.S. auto industry in September 2017. After eight consecutive months of decline, auto sales grew in September. But October’s results once again manifested a gradual and marginal decline.
U.S. auto sales slid roughly 1 percent in October 2017 thanks in large part to sharp decreases at Fiat Chrysler Automobiles’ Dodge brand and a 15-percent Hyundai drop. Chrysler, Fiat, Jaguar, and Maserati were the only other brands to report double-digit percentage losses.
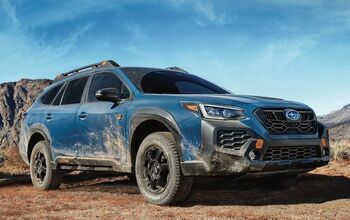
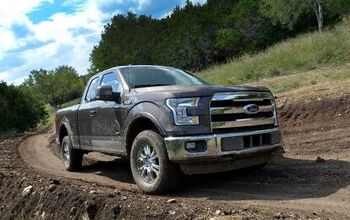
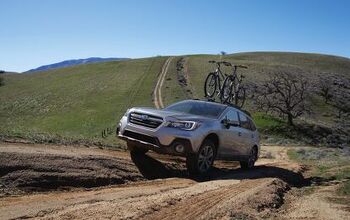
Meanwhile, auto sales continued to grow at Audi and Subaru, which reported their 82nd and 71st consecutive monthly improvements. Meaningful increases were also reported at Ford, Nissan, and Volkswagen. Toyota sales rose more than 2 percent.
Yet even midst a modest October decline, the story continues to be of lofty incentives. Across the industry, ALG says, incentive spending per unit was up 8 percent compared with October 2016, surging to $3,820 per vehicle. At General Motors, incentive spending shot up 15 percent to more than $5,100 per vehicle.
October 2017 featured one fewer selling day than October 2016 as well as one fewer weekend. The industry’s daily selling rate actually rose 4 percent.
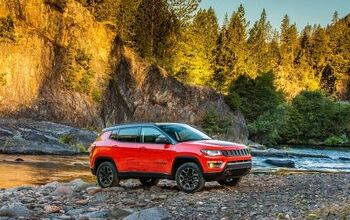
Auto BrandOct. 2017Oct. 2016% Change2017 YTD2016 YTD% ChangeAcura 12,69812,869-1.3%126,824132,596-4.4%Alfa Romeo 1,205235,139%8,5574411,840%Audi 19,42517,7219.6%180,339169,9006.1%BMW %%Buick 19,14220,046-4.5%178,972189,813-5.7%Cadillac 13,93113,948-0.1%127,777133,234-4.1%Chevrolet 175,110181,964-3.8%1,691,2981,713,876-1.3%Chrysler 11,01814,181-22.3%154,827200,678-22.8%Dodge 24,47641,514-41.0%390,266436,454-10.6%Fiat 1,7692,622-32.5%23,02127,721-17.0%Ford 190,789178,6236.8%2,032,4542,075,481-2.1%Genesis 1,7861,20148.7%16,8883,909332%GMC 44,63042,6684.6%450,264434,1003.7%Honda 114,655113,2921.2%1,232,1321,221,9450.8%Hyundai 53,01062,505-15.2%564,750650,193-13.1%Infiniti 10,29611,208-8.1%124,010107,98314.8%Jaguar 2,8913,219-10.2%33,11923,56840.5%Jeep 67,07468,826-2.5%689,316775,932-11.2%Kia 44,39748,977-9.4%502,327540,741-7.1%Land Rover 5,4775,532-1.0%59,95859,9230.1%Lexus 22,89424,803-7.7%242,553260,996-7.1%Lincoln 8,9099,069-1.8%91,63189,5042.4%Maserati 1,1401,304-12.6%11,1299,46017.6%Mazda 20,81122,711-8.4%241,108246,978-2.4%Mercedes-Benz °28,955 28,659 1.0%271,205 277,863-2.4% Mercedes-Benz Vans ° 2,4462,724 -10.2% 27,673 27,880 -0.7% Total Mercedes-Benz °31,40131,801-0.8%301,653310,205-2.8%Mini %%Mitsubishi 7,3817,637-3.4%86,57681,9885.6%Nissan 112,716102,31210.2%1,195,2431,188,5610.6%Porsche 4,7154,5064.6 %45,95244,7522.7%Ram 47,83149,443-3.3%466,524449,7433.7%Smart 140418-66.5%2,7754,462-37.8%Subaru 54,04553,7600.5%532,893500,6476.4%Toyota 165,540161,4922.5%1,777,3601,747,7601.7%Volkswagen 27,73224,77911.9%280,188256,0479.4%Volvo 7,0086,34010.5%63,97464,872-1.4%————— ——BMW Group%%Fiat Chrysler Automobiles154,513176,609-13.2%1,732,5111,890,969-8.4%Daimler AG 31,54131,801-0.8%301,653310,205-2.8%Ford Motor Co. 199,698187,6926.4%2,124,0852,164,985-1.9%General Motors 252,813258,626-2.2%2,448,3112,471,023-0.9%American Honda 127,353126,1610.9%1,358,9561,354,5410.3%Hyundai-Kia Automotive Group 97,407111,482-12.6%1,067,0771,190,934-10.4%Jaguar-Land Rover 8,3688,751-4.4%93,07783,49111.5%Nissan / Infiniti / Mitsubishi 123,012113,5208.4%1,319,2531,296,5441.8%Toyota Motor Sales, USA. Inc. 188,434186,2951.1%2,019,9132,008,7560.6%Volkswagen Group * 52,06047,31810.0%508,339472,4867.6%———————Industry Total † 1,329,8021,343,804-1.0% 13,957,76714,185,901-1.6%Source: Manufacturers
* Volkswagen Group includes sales figures for Audi, Bentley, Porsche, and Volkswagen brands
° Mercedes-Benz USA releases sales figures for the Mercedes-Benz brand in the conventional sense, vans excluded, as well as totals for the Metris and Sprinter vans. The complete picture is included here.
† Industry total takes into account Automotive News figures/estimates for brands such as Tesla (4,900 October units) and other low-volume, high-priced manufacturers but does not yet include figures for the BMW Group, which has delayed reporting.
[Image: Volkswagen]
Timothy Cain is a contributing analyst at The Truth About Cars and Autofocus.ca and the founder and former editor of GoodCarBadCar.net. Follow on Twitter @timcaincars.
More by Timothy Cain


Comments
Join the conversation
Wow, is the Atlas really that much bigger than the Tiguan?!
Alfa sales up 1840% - job well done!!!