4 Views
March 2013 U.S. Car Sales
by
Derek Kreindler
(IC: employee)
Published: April 2nd, 2013
Share
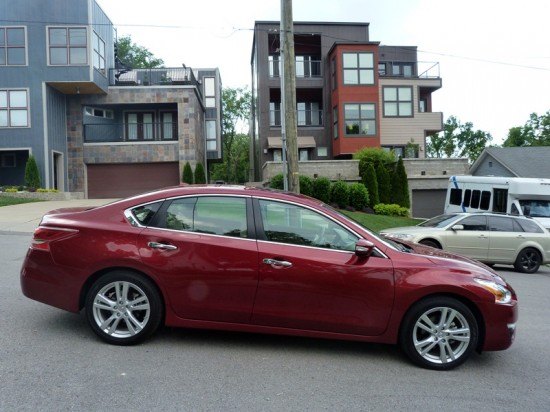
Honda and the Big Three posted the biggest gains this month, and we’re getting word that March’s best-selling car was the Nissan Altima, followed closely by the Camry and Accord.
Table courtesy Automotive News
AutomakerMarch 2013March 2012Pct. chng.3 monthDerek Kreindler
More by Derek Kreindler
Published April 2nd, 2013 3:34 PM
Latest Car Reviews
Read moreLatest Product Reviews
Read moreRecent Comments
- Dale Quelle surprise.
- 3SpeedAutomatic Nice looking, but IIRC, there was an issue with these engines where a knock would develop. That may account for the very low milage. 🚗🚗🚗
- Redapple2 Used to watch F 1 a great deal. Now? F1 Random thoughts:1 Silly rules bug me. Must use 2 types of tire. Cant refuel. Drag reduction can only be used in certain areas of the track and only if you are so close to the car in front.2 Passing is rare. Pole sitter wins a high % of the time.3 A new team can only start in F1 if they get the blessing of the overlords. Evil gm Vampire was barred. How about this. Anybody with a car that meets the construction rules can try. If your speed qualifies and you pay the entry fee. You re in. So is anybody else. 4 I tune in for Martin Brundle's grid walk. In my life, it s must see tv. But he is often bumped or cancelled. Grid walk takes place 1 out of 3 or 4 races.5 So, because of this utter bull sheet and other points, I ve migrated to IMSA and MotoGP. I might catch a summary on the youtube.
- Redapple2 I retract my comments and apologize.
- Flashindapan I always thought these look nice. I was working at a Land Rover dealership at the time the LR3 came out and we were all impressed how much better it was then the Discovery in just about every measurable way.















Comments
Join the conversation
The two outliers at opposite ends of the pricing/financing spectrum, Land Rover 4,314 Mitsubishi 5,286 So there are at least 9600 suckers out there.
Avenger/200's are the 2010's [yes, this is a different decade!] fleet queens, I see so any around OHare airport with bar code stickers. It's like the 2004-07 Taurus again. They are also cheap 'nearly new' used cars for Subprime buyers, maybe $11,995 for two year old Avengers, available by the truckload.