U.S. Auto Sales Brand-By-Brand Results: March 2017 YTD

Timothy Cain
by Timothy Cain

March 2017’s U.S. auto sales volume dropped nearly 2 percent compared with March 2016, failing to live up to forecasts that expected March to be the best end to the first-quarter in nearly two decades.

Despite record volume at Nissan and Infiniti, continued growth at Subaru, meaningful gains at Buick, GMC, Dodge, Mitsubishi, and Ram, a third consecutive month of improvement at Mazda, and minor improvements at numerous other brands, auto sales fell below March 2016 levels because of declines at Ford, Toyota, and Fiat Chrysler. Hyundai and Kia combined for an 11-percent slide.

A third consecutive month of year-over-year decline for the industry suggests doom and gloom, as does the fact that inventories are ballooning and incentives are rising. Auto sales remain high, however, and only in comparison with 2016 — a banner year for the industry — do sales appear poor. Through the first-quarter of 2017, U.S. auto sales are down by less than 2 percent.

Auto BrandMarch 2017March 2016% Change2017 YTD2016 YTD% ChangeAcura 11,69614,852-21.2%31,76237,875-16.1%Alfa Romeo 555431,191%1,106158600%Audi 18,70518,3921.7%45,64741,9608.8%BMW 31,01530,0333.3%71,68270,6131.5%Buick 20,95718,20715.1%50,20554,287-7.5%Cadillac 12,86113,053-1.5%33,96235,633-4.6%Chevrolet 172,458176,283-2.2%471,723472,730-0.2%Chrysler 16,96925,373-33.1%47,07670,424-33.2%Dodge 50,07645,629 9.7%134,063140,916-4.9%Fiat 2,9223,085 -5.3%7,2318,115-10.9%Ford 225,341243,375-7.4%586,462616,682-4.9%Genesis 1,755——5,155——GMC 49,94844,58512.0%133,611121,04810.4%Honda 125,531123,3691.8%333,531319,9284.3%Hyundai 67,51075,310 -10.4%163,637173,330-5.6%Infiniti 18,26613,77532.6%43,56132,66033.4%Jaguar 4,9532,133 132%11,3764,997128%Jeep 67,98376,540 -11.2%188,743212,370-11.1%Kia 49,42958,279-15.2% 127,728146,321-12.7%Land Rover 7,9658,733 -8.8%19,87520,805-4.5%Lexus 27,93530,198-7.5%61,84574,221-16.7%Lincoln 9,5549,689-1.4%27,08324,9058.7%Maserati 1,31299731.6%3,2882,25046.1%Mazda 24,54923,3964.9%69,07164,6446.8%Mercedes-Benz ° 29,09228,164 3.3% 79,141 75,769 4.5% Mercedes-Benz Vans ° 2,8713,072 -6.5% 7,433 7,240 2.7% Total Mercedes-Benz ° 31,96331,2362.3% 86,57483,0094.3%Mini 4,9874,7624.7%10,25110,839-5.4%Mitsubishi 11,76611,078 6.2%29,14725,21215.6%Nissan 150,566149,7840.5%373,330217,76071.4%Porsche 4,4794,3233.6%12,71812,2383.9%Ram 51,74948,797 6.0%132,579126,1545.1%Smart 389479-18.9%1,0611,300-18.4%Subaru 54,87149,28511.3%144,250132,3979.0%Toyota †187,289189,644-1.2%470,766494,859-4.9%Volkswagen 27,63526,9142.7%76,29069,31410.1%Volvo 5,3566,857-21.9%13,47916,361-17.6%————— ——BMW-Mini 36,00234,7953.5%81,93381,4520.6%Fiat Chrysler Automobiles 190,254199,467-4.6%510,798558,137-8.5%DaimlerAG32,35231,7152.0%87,63584,3093.9%Ford Motor Co.234,895253,064-7.2%613,545641,587-4.4%General Motors 256,224252,1281.6%689,521683,6980.9%Honda Motor Co.137,227138,221-0.7%363,293 357,7032.1%Hyundai-Kia 118,694133,589-11.1%296,520 319,651-7.2%Jaguar-Land Rover 12,91810,86618.9%31,251 25,80221.1%Nissan Motor Co./Mitsubishi180,598174,6373.4%446,038425,4164.8%Toyota Motor Corp.215,224219,842-2.1%532,611 569,080-6.4%Volkswagen Group *51,06849,7482.7%135,207123,7749.2%———————Industry Total **1,554,9981,581,300 -1.7% 4,030,5934,094,065 -1.6%

Source: Manufacturers

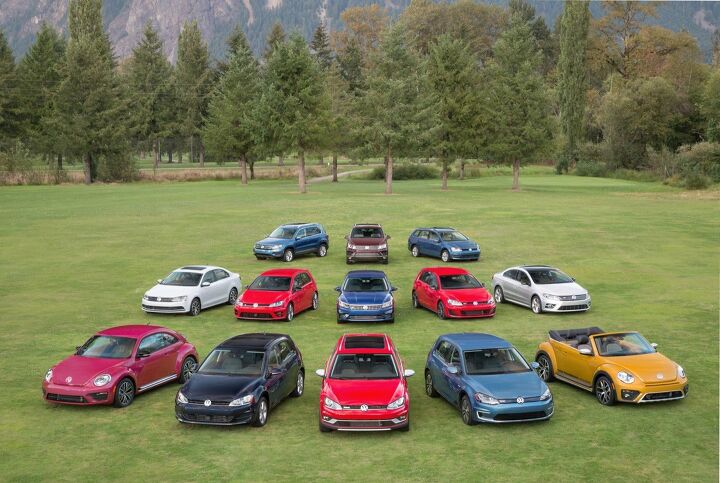
* Volkswagen Group includes sales figures for Audi, Bentley, Porsche, and Volkswagen brands

° Mercedes-Benz USA releases sales figures for the Mercedes-Benz brand in the conventional sense, vans excluded, as well as totals for the Metris and Sprinter vans. The complete picture is included here.

† Toyota’s sales figures include those of Toyota’s discontinued Scion brand.

** Industry total takes into account Automotive News figures/estimates for brands such as Tesla (3,000 March units) and other low-volume, high-priced manufacturers.

Timothy Cain is the founder of GoodCarBadCar.net, which obsesses over the free and frequent publication of U.S. and Canadian auto sales figures.

Timothy Cain
Timothy Cain

More by Timothy Cain

Comments
Join the conversation
2 of 72 comments
  • Jimmyy Jimmyy on Apr 04, 2017

    Another interesting point ... the Camry is now outselling the Fusion by nearly 2 to 1. This shows how, more and more, the buying public considers a car nothing more than a commodity and the Fusion will lose this comparison since the rear seat headroom is just not there. When you buy as a commodity, you care more about rear seat headroom than bling.

  • SuperCarEnthusiast SuperCarEnthusiast on Apr 04, 2017

    Surprise me is that Lexus and Volkswagen are same in numbers - 27K. BMW 31K, Mercedes at 29K. Mazda at 24K and Cadillac 12K and Land Rover at 8!

  • Pig_Iron This message is for Matthew Guy. I just want to say thank you for the photo article titled Tailgate Party: Ford Talks Truck Innovations. It was really interesting. I did not see on the home page and almost would have missed it. I think it should be posted like Corey's Cadillac series. 🙂
  • Analoggrotto Hyundai GDI engines do not require such pathetic bandaids.
  • Slavuta They rounded the back, which I don't like. And inside I don't like oval shapes
  • Analoggrotto Great Value Seventy : The best vehicle in it's class has just taken an incremental quantum leap towards cosmic perfection. Just like it's great forebear, the Pony Coupe of 1979 which invented the sportscar wedge shape and was copied by the Mercedes C111, this Genesis was copied by Lexus back in 1998 for the RX, and again by BMW in the year of 1999 for the X5, remember the M Class from the Jurassic Park movie? Well it too is a copy of some Hyundai luxury vehicles. But here today you can see that the de facto #1 luxury SUV in the industry remains at the top, the envy of every drawing board, and pentagon data analyst as a pure statement of the finest automotive design. Come on down to your local Genesis dealership today and experience acronymic affluence like never before.
  • SCE to AUX Figure 160 miles EPA if it came here, minus the usual deductions.It would be a dud in the US market.
Next