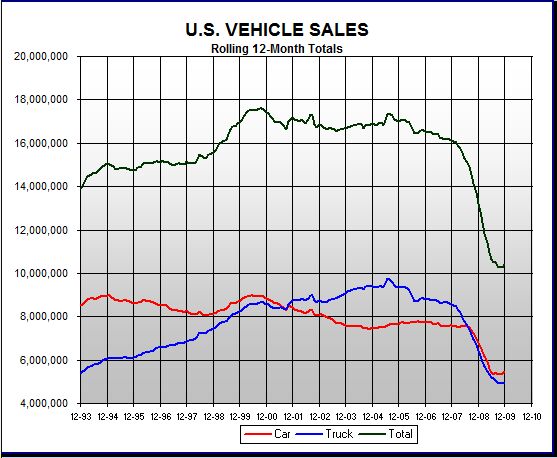
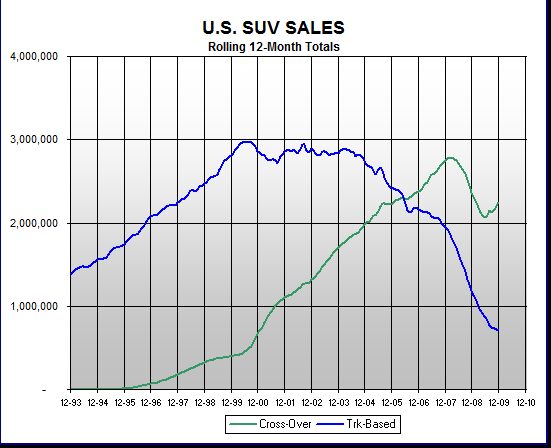
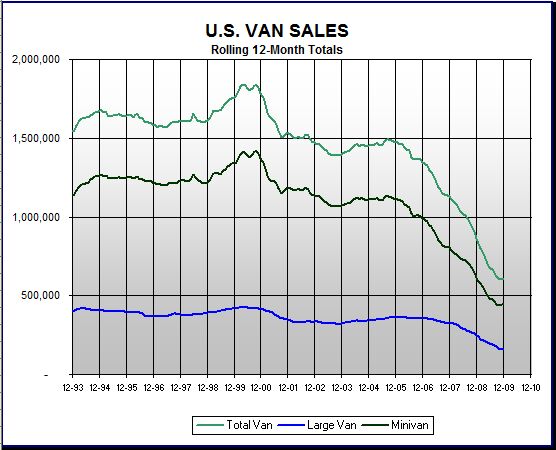
Its obvious to see the “cash for clunkers” spike this year, but does anyone know what the similar sized spike in Jul-Aug of ’05 and Oct-Nov. of ’01 are?
EDIT: Found this article which attributes ’01 auto sales spike to automaker’s 0% financing deals, post 9-11.
http://money.cnn.com/2001/11/01/companies/carsales/
Found this article that attributes ’05 sales spike to automaker’s employee discount pricing for everyone.
http://www.econbrowser.com/archives/2005/08/record_auto_sal.html
So both spikes were caused by the U.S. automakers offering huge incentives….buying sales.
It will be real interesting to see what happens to sales as we move into 2010. Many people, including myself, took advantage of cash for clunkers, 2009 sales tax writeoff, and year end clearance and model clearance (aka Pontiac.) Many of those people are set for quite a few years. What kind of demand will there be in 2010?
I’m surprised it took until the year 2000 for truck sales to eclipse car sales- I usually think of the SUV boom as being in full-swing by the millenium. It’s amusing how the rise and fall of the truck market matches the track of the real estate bubble.
It makes perfect sense. New home construction needs light trucks. Construction falls, so does new truck sales to contractors. Not all light trucks sold are for personal use.
Does “domestic” mean produced in the US (meaning including Camrys, BMW, etc. produced in the US) and “import” anything produced outside the US(incl. GM, Ford, Chryco; also anything produced in Canada and Mexico)?
to me it does… but some “patriots” assume domestic anything with a big-3 nameplate.
I have one domestic car (Mazda 6) and one imported car (Mazda 3).
As do I, can we have some ‘Truth’ in those first two graphs please?
Distorting the vertical axis’ like that makes the ’00 sales peak look twice as big as the ’08 when in reality it’s 50% more. That is a hell of a distortion and a classic spin tactic – something I thought that TTAC abhors.
Visually, a definite improvement over Morgan and Co.’s previous graphs for TTAC. Two suggestions: identify the source of the data (R.L. Polk perhaps?) and overlay the raw series whenever plotting a rolling average.
Gathering sales figures by vehicle line from over a dozen manufacturers’ press releases each month going back 16 years is an amazing effort. God bless them.
Its obvious to see the “cash for clunkers” spike this year, but does anyone know what the similar sized spike in Jul-Aug of ’05 and Oct-Nov. of ’01 are?
EDIT: Found this article which attributes ’01 auto sales spike to automaker’s 0% financing deals, post 9-11.
http://money.cnn.com/2001/11/01/companies/carsales/
Found this article that attributes ’05 sales spike to automaker’s employee discount pricing for everyone.
http://www.econbrowser.com/archives/2005/08/record_auto_sal.html
So both spikes were caused by the U.S. automakers offering huge incentives….buying sales.
It will be real interesting to see what happens to sales as we move into 2010. Many people, including myself, took advantage of cash for clunkers, 2009 sales tax writeoff, and year end clearance and model clearance (aka Pontiac.) Many of those people are set for quite a few years. What kind of demand will there be in 2010?
I’m surprised it took until the year 2000 for truck sales to eclipse car sales- I usually think of the SUV boom as being in full-swing by the millenium. It’s amusing how the rise and fall of the truck market matches the track of the real estate bubble.
It makes perfect sense. New home construction needs light trucks. Construction falls, so does new truck sales to contractors. Not all light trucks sold are for personal use.
I’d like to see those chart include gasoline prices in constant 2010 dollars. There would likely be a high correlation with SUV and truck sales.
Does “domestic” mean produced in the US (meaning including Camrys, BMW, etc. produced in the US) and “import” anything produced outside the US(incl. GM, Ford, Chryco; also anything produced in Canada and Mexico)?
to me it does… but some “patriots” assume domestic anything with a big-3 nameplate.
I have one domestic car (Mazda 6) and one imported car (Mazda 3).
I generally frown on plots that don’t have a zero on the y-axis
As do I, can we have some ‘Truth’ in those first two graphs please?
Distorting the vertical axis’ like that makes the ’00 sales peak look twice as big as the ’08 when in reality it’s 50% more. That is a hell of a distortion and a classic spin tactic – something I thought that TTAC abhors.
Data is cool.
Visually, a definite improvement over Morgan and Co.’s previous graphs for TTAC. Two suggestions: identify the source of the data (R.L. Polk perhaps?) and overlay the raw series whenever plotting a rolling average.
They gather it from the manufacturers’ press releases each month.
Gathering sales figures by vehicle line from over a dozen manufacturers’ press releases each month going back 16 years is an amazing effort. God bless them.