
Japan In September 2012: Coming Back To Earth
September was the month when the torrid growth of Japanese car sales came to an end. Sales of all cars were down 3.4 percent in Japan. The market is down for two reasons, mathematical and governmental.
The mathematical reason for the arrested growth lies in the fact that in September 2011, Japanese car sales, severely depressed as a result of the March 11 tsunami, showed first signs of recovery. The governmental reason weighs heavier on September sales: The incentive program came to a halt in September.
Regular vehicle sales Japan September 2012ManufacturerSept ’12Sept ’11YoYYTD ’12YTD ’11YoYDaihatsu241333-27.6%2,3032,1377.8%Hino4,7044,5144.2%32,04124,93028.5%Honda26,18843,422-39.7%365,463278,45531.2%Isuzu6,9154,58350.9%46,22330,68050.7%Lexus3,7925,770-34.3%34,40032,0207.4%Mazda15,53117,409-10.8%136,678112,90021.1%Mitsubishi8,0346,47924.0%46,28142,8927.9%Mitsubishi Fuso2,9883,109-3.9%26,56918,35844.7%Nissan51,31253,427-4.0%406,013338,71019.9%Subaru11,8519,07430.6%76,72156,33336.2%Suzuki7,4717,3691.4%73,03758,90224.0%Toyota121,937131,072-7.0%1,274,983813,59256.7%UD Trucks8561,024-16.4%6,8865,78319.1%Other26,65826,2051.7%178,729151,25918.2%Total288,478313,790-8.1%2,706,3271,966,95137.6%Data courtesy Japan Automobile Dealers AssociationSales of registered cars were down 8.1 percent, says the Japan Automobile Dealers Association.
Mini vehicle sales Japan September 2012ManufacturerSept ’12Sept ’11YoYYTD ’12YTD ’11YoYSuzuki50,51046,0859.6%462,806353,73130.8%Daihatsu51,55152,092-1.0%541,425393,31837.7%Mitsubishi6,0049,842-39.0%65,16972,965-10.7%Subaru4,6618,449-44.8%60,92560,4740.7%Honda27,17312,091124.7%240,90396,030150.9%Mazda4,7124,950-4.8%41,53634,78419.4%Nissan10,19114,675-30.6%123,792105,83817.0%Toyota3,3992161473.6%35,02321616114.4%Other71600.0%372927.6%Total158,208148,4016.6%1,571,6161,117,38540.7%Data courtesy Japan Mini Vehicles AssociationSeparately reported sales of mini vehicles defied gravity and were up 6.6 percent according to data supplied by the Japan Mini Vehicles Association.
Total vehicle sales Japan September 2012ManufacturerSept ’12Sept ’11YoYYTD ’12YTD ’11YoYDaihatsu51,79252,425-1.2%543,728395,45537.5%Hino4,7044,5144.2%32,04124,93028.5%Honda53,36155,513-3.9%606,366374,48561.9%Isuzu6,9154,58350.9%46,22330,68050.7%Lexus3,7925,770-34.3%34,40032,0207.4%Mazda20,24322,359-9.5%178,214147,68420.7%Mitsubishi14,03816,321-14.0%111,450115,857-3.8%Mitsubishi Fuso2,9883,109-3.9%26,56918,35844.7%Nissan61,50368,102-9.7%529,805444,54819.2%Subaru16,51217,523-5.8%137,646116,80717.8%Suzuki57,98153,4548.5%535,843412,63329.9%Toyota125,336131,288-4.5%1,310,006813,80861.0%UD Trucks8561,024-16.4%6,8865,78319.1%Other26,66526,2061.8%178,766151,28818.2%Total446,686462,191-3.4%4,277,9433,084,33638.7%On a consolidated basis, sales dropped percent to 446,686units in September. January through September, the Japanese market (all vehicles) is up 38.7 percent to 4.3 million units, up from 3.1 million units in an earthquake-stricken 2011.
Market Share Japan September 2012ManufacturerSept ’12Sept ’11YTD ’12YTD ’11Daihatsu11.6%11.3%12.7%12.8%Hino1.1%1.0%0.7%0.8%Honda11.9%12.0%14.2%12.1%Isuzu1.5%1.0%1.1%1.0%Lexus0.8%1.2%0.8%1.0%Mazda4.5%4.8%4.2%4.8%Mitsubishi3.1%3.5%2.6%3.8%Mitsubishi Fuso0.7%0.7%0.6%0.6%Nissan13.8%14.7%12.4%14.4%Subaru3.7%3.8%3.2%3.8%Suzuki13.0%11.6%12.5%13.4%Toyota28.1%28.4%30.6%26.4%UD Trucks0.2%0.2%0.2%0.2%Other6.0%5.7%4.2%4.9%Total100.0%100.0%100.0%100.0%In terms of market share, Toyota-branded vehicles gained an impressive 4.2 percent, followed by Honda with a 2 percent gain. Nissan lost 2 percent.
Japan Big Three September 2012GroupToyota Motor CoNissanHondaUnits Sept ’12181,83261,50353,361Units Sept ’11188,22768,10255,513Units YoY-3.4%-9.7%-3.9%MS Sept ’1240.7%13.8%11.9%MS Sept ’1140.7%14.7%12.0%Units YTD ’121,885,775529,805606,366Units YTD ’111,234,193444,548374,485MS YTD ’1244.1%12.4%14.2%MS YTD ’1140.0%14.4%12.1%YoY YTD52.8%19.2%61.9%Looking at the Big Three, Toyota and Honda exceed the market, Nissan is falling behind.
All in all, it will be interesting to see what October and November will bring. Japan is a make-to-order market, and purchases do not immediately translate into registrations.

Bertel Schmitt comes back to journalism after taking a 35 year break in advertising and marketing. He ran and owned advertising agencies in Duesseldorf, Germany, and New York City. Volkswagen A.G. was Bertel's most important corporate account. Schmitt's advertising and marketing career touched many corners of the industry with a special focus on automotive products and services. Since 2004, he lives in Japan and China with his wife <a href="http://www.tomokoandbertel.com"> Tomoko </a>. Bertel Schmitt is a founding board member of the <a href="http://www.offshoresuperseries.com"> Offshore Super Series </a>, an American offshore powerboat racing organization. He is co-owner of the racing team Typhoon.
More by Bertel Schmitt


Comments
Join the conversation
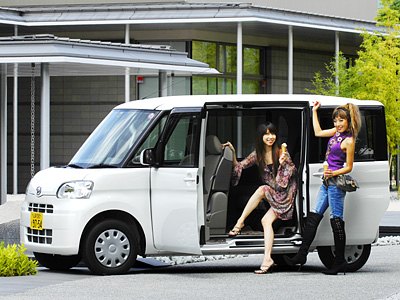
Nice photo. Is that the Japanese version of a pimp mobile? Looking at those chicks, well, the word scholarly doesn't exactly come to mind.
Uhm, compared to last month (august 2012): Group Toyota Motor Co Nissan Honda Units 168,221 41,736 47,449 Increase of sales? Despite end of incentives? http://www.thetruthaboutcars.com/2012/09/japan-in-august-2012-back-to-earth-but-no-crash-landing/ That should be a story... when did the incentives run out? I thought it was end of August?