


Europe Ends The Year With A Bang - On The Nose
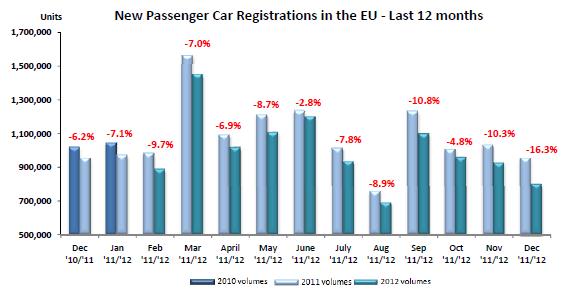
New car registrations dropped a painful 16.3 percent in Europe in an acceleration of a long, and initially slow a downward trend . The European carmaker association ACEA calls the decline ”the steepest recorded in a month of December since 2008.” For the year the EU market was down 8.2 percent to 12,053,904 units, which is the “lowest level recorded since 1995,” says the ACEA.
Most of the Europe’s volume markets recorded a double-digit downturn ranging from -14.6 percent in France to -16.4 percent in Germany, -22.5 percent in Italy and -23.0 percent in Spain. The UK was the only volume market to post growth (+3.7 percent).
Industry contacts in Europe explain the acceleration not with a decreasing reluctance to buy cars. “A lot of people stopped buying cars long ago,” said a contact at a large European OEM, “but the dealers continued to buy. This is coming to an end.” He was alluding to the phenomenon of “one day registrations” where dealers buy the car to make their quota and to collect the incentive money, only to put the car up for sale “used” the next day at prices of sometimes 30 percent below list. When sold, these new cars then show up in the used car registration numbers.
In the meantime, supply and production have been adjusted, the bulge has worked itself through the anaconda and has been digested. We can expect sales data that more reflect real buying behavior.
EU New passenger car registrations 2012January – December %ShareUnitsUnits% Chg’12’11’12’1112/11ALL BRANDS**12,053,90413,130,466-8.2VW Group24.723.02,977,4163,026,192-1.6VOLKSWAGEN12.812.31,541,6431,616,483-4.6AUDI5.65.0673,647653,427+3.1SEAT2.12.3251,528296,145-15.1SKODA3.93.5465,341458,209+1.6Others (1)0.40.045,2571,928+2247.4PSA Group11.912.51,431,0631,643,457-12.9PEUGEOT6.46.8774,435889,264-12.9CITROEN5.45.7656,628754,193-12.9RENAULT Group8.59.71,030,3211,273,178-19.1RENAULT6.67.8795,9721,026,736-22.5DACIA1.91.9234,349246,442-4.9GM Group8.28.7984,1771,142,117-13.8OPEL/VAUXHALL6.87.4815,961968,550-15.8CHEVROLET1.41.3167,917173,083-3.0GM (US)0.00.0299484-38.2FORD7.68.0910,3181,048,814-13.2FIAT Group6.57.1779,606929,551-16.1FIAT4.75.1570,980673,401-15.2LANCIA/CHRYSLER0.80.892,446102,122-9.5ALFA ROMEO0.71.086,858125,924-31.0JEEP0.20.225,67322,211+15.6Others (2)0.00.03,6495,893-38.1BMW Group6.45.9767,541781,248-1.8BMW5.14.7614,779618,029-0.5MINI1.31.2152,762163,219-6.4DAIMLER5.35.0633,142652,790-3.0MERCEDES4.74.4565,161575,243-1.8SMART0.60.667,98177,547-12.3TOYOTA Group4.24.0507,731523,909-3.1TOYOTA4.03.8483,131498,384-3.1LEXUS0.20.224,60025,525-3.6NISSAN3.53.4417,636445,826-6.3HYUNDAI3.42.9414,827379,144+9.4KIA2.72.2327,995287,388+14.1VOLVO CAR CORP.1.81.8212,578235,841-9.9SUZUKI1.21.3144,292167,071-13.6HONDA1.11.1133,462142,436-6.3JAGUAR LAND ROVER Group1.00.7120,03395,420+25.8LAND ROVER0.80.696,84772,793+33.0JAGUAR0.20.223,18622,627+2.5MAZDA0.91.0114,208128,721-11.3MITSUBISHI0.60.867,888101,337-33.0OTHER**0.71.079,669126,026-36.8Source: ACEAFor the year, the Volkswagen Group weathered the downturn with only a 1.6 percent loss, and a 1.7 percent gain in Market share. GM, Ford and Fiat had to digest double digit losses, so did PSA and Renault.
EU New passenger car registrations December 2012December %ShareUnitsUnits% Chg’12’11’12’1112/11ALL BRANDS**799,407955,537-16.3VW Group23.323.3186,347222,492-16.2VOLKSWAGEN11.712.693,309120,021-22.3AUDI4.74.837,24745,964-19.0SEAT2.32.318,63721,994-15.3SKODA4.23.633,81134,388-1.7Others (1)0.40.03,343125+2574.4PSA Group11.211.589,710109,666-18.2PEUGEOT6.26.149,69458,276-14.7CITROEN5.05.440,01651,390-22.1RENAULT Group9.39.774,65292,237-19.1RENAULT6.97.755,30073,659-24.9DACIA2.41.919,35218,578+4.2GM Group7.89.062,64086,044-27.2OPEL/VAUXHALL6.57.452,13070,657-26.2CHEVROLET1.31.610,50015,331-31.5GM (US)0.00.01056-82.1FORD6.67.552,47571,884-27.0FIAT Group6.26.349,31160,010-17.8FIAT4.64.536,42442,798-14.9LANCIA/CHRYSLER0.70.85,5297,227-23.5ALFA ROMEO0.60.84,9847,713-35.4JEEP0.30.22,2041,988+10.9Others (2)0.00.0170284-40.1BMW Group7.96.663,17162,993+0.3BMW6.45.150,81049,033+3.6MINI1.51.512,36113,960-11.5DAIMLER5.85.346,51950,965-8.7MERCEDES5.44.842,89345,915-6.6SMART0.50.53,6265,050-28.2TOYOTA Group4.54.836,05145,965-21.6TOYOTA4.44.634,98543,704-20.0LEXUS0.10.21,0662,261-52.9NISSAN3.43.326,99931,104-13.2HYUNDAI4.23.233,33730,177+10.5KIA3.02.323,70222,195+6.8VOLVO CAR CORP.2.21.817,56517,109+2.7SUZUKI1.11.38,54312,325-30.7HONDA1.11.09,0299,630-6.2JAGUAR LAND ROVER Group1.10.98,9128,327+7.0LAND ROVER0.90.77,0236,637+5.8JAGUAR0.20.21,8891,690+11.8MAZDA1.00.87,6957,253+6.1MITSUBISHI0.60.64,6436,191-25.0OTHER-0.20.9-1,8948,970-121.1Source: ACEAIn December, Volkswagen registered similar losses as those of its major competitors. However, a lot of this goes on account of the Golf 7 launch. It had started in November and still hasn’t reached all of Europe. Audi and Seat however also did hurt.
Data are available as Excel file here and as PDF here. A historical series of yearly data, going back until 1990 can be downloaded here.

Bertel Schmitt comes back to journalism after taking a 35 year break in advertising and marketing. He ran and owned advertising agencies in Duesseldorf, Germany, and New York City. Volkswagen A.G. was Bertel's most important corporate account. Schmitt's advertising and marketing career touched many corners of the industry with a special focus on automotive products and services. Since 2004, he lives in Japan and China with his wife <a href="http://www.tomokoandbertel.com"> Tomoko </a>. Bertel Schmitt is a founding board member of the <a href="http://www.offshoresuperseries.com"> Offshore Super Series </a>, an American offshore powerboat racing organization. He is co-owner of the racing team Typhoon.
More by Bertel Schmitt


Comments
Join the conversation
Based on the December figures, Hyundai/Kia are getting close to catching up to the combined sales of Toyota and Nissan.
Sure, sales are a little soft right now, but the long-term future is bright. Europeans are having kids like crazy and there's no end in sight to the population boom. Regulatory hurdles are being swept away. Yes, manufacturers won't be able to keep up with demand!