


This Is A Tsunami Wave
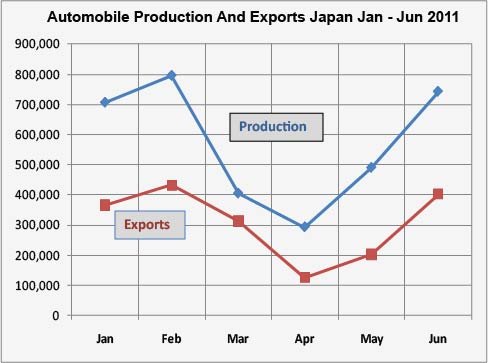
The Japanese auto industry slowly but surely is clawing back from the abyss created by one of the worst disasters that were visited upon the island nation. Following the March 11 earthquake and tsunami, the industry had crashed. Three months later and earlier than thought, the industry is at near pre-disaster levels. Data released by the Japan Auto Manufacturers Association shows the June production at 742,431 units, only 13.9 percent below June 2010.
Japanese Production 2011 By Automaker
JanFebMarAprMayJunToyota234,045283,556129,49153,823107,437249,660Nissan81,85193,43247,59044,19380,036102,390Mitsubishi60,08961,58249,43427,48147,01359,069Mitsubishi Fuso4,5816,0572,6351,6063,9957,833Mazda68,84170,42839.88735,31362,20880,114Isuzu18,12517,9348,0294,79416,02921,096Honda69,17070,34634,75414,16834,74643,289Hino8,3559,6284,7584,9407,04911,403Suzuki73,94683,72941,79058,39864,84875,475Daihatsu48,44056,71628,09120,57841,89359,389Subaru36,21040,72916,53025,39122,43829,910UD Trucks2,2931,3348891,2261,8982,597Others16116116190133206Total Production706,107795,632404,039292,001489,723742,431Exports365,288431,582312,478126,061202,833402,042Once the remaining effects of the disaster have been overcome, we can expect year-on-year growth in the last quarter of 2011 and especially in the first quarter of 2012. But the damage is done.
So far, output in Japan alone is 3,429,934 units for the first six months, down 29.2 percent from the 4,843,770 units total recorded in the first half of 2010. That’s 1,413,836 units swept away, in Japan alone.
Automobile exports for the first half of the year were 1,840,164 units, 20.8 percent below the 2,324,098 units exported in the first six months of 2010.
What you see here are just the effects in and on Japan. A picture of the global effects on Japan’s Top Six can be seen here.

Bertel Schmitt comes back to journalism after taking a 35 year break in advertising and marketing. He ran and owned advertising agencies in Duesseldorf, Germany, and New York City. Volkswagen A.G. was Bertel's most important corporate account. Schmitt's advertising and marketing career touched many corners of the industry with a special focus on automotive products and services. Since 2004, he lives in Japan and China with his wife <a href="http://www.tomokoandbertel.com"> Tomoko </a>. Bertel Schmitt is a founding board member of the <a href="http://www.offshoresuperseries.com"> Offshore Super Series </a>, an American offshore powerboat racing organization. He is co-owner of the racing team Typhoon.
More by Bertel Schmitt


Comments
Join the conversation
Interesting numbers but the graph is graphically pretty poor, I don't know if the source produced it but it seems similar to other TTAC produced graphs, A bar graph would be a much better representation, the line graph visually implies that production fell off a cliff before the Tsunami disaster, a line graph might work with weekly data points but not monthly, I was totally confused at first until I got to the hard numbers chart. It works with the wave idea but isn't very good at depicting the data
http://www5.picturepush.com/photo/a/6199813/640/6199813.bmp