

U.S. Auto Sales Brand-By-Brand Results: June 2016 YTD

A modest increase of 2 percent fell below expectations from forecasters that the U.S. auto industry would grow by more than 5 percent in June 2016. Indeed, given the extra day on June 2016’s auto sales calendar, the daily selling rate for the industry actually declined in June, albeit marginally.
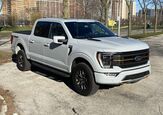
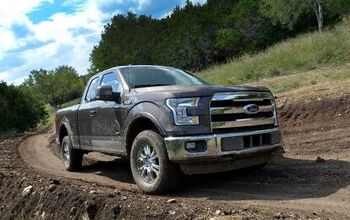
Big gains were nevertheless not uncommon. The Ford Motor Company, Fiat Chrysler Automobiles, Nissan-Infiniti, and Hyundai-Kia all posted above-average gains. Ford’s best-selling F-Series, which accounted for three-in-ten sales at Ford’s namesake brand, posted a 29-percent year-over-year increase. Overall pickup truck sales, powered in large part by the Ford’s 15,766-unit increase, jumped 10 percent.
The Toyota Camry claimed the top spot among cars despite its own sharp decline, a 13-percent loss worth nearly 5,000 sales. For the first time since last October, the Honda CR-V was America’s top-selling SUV/crossover.
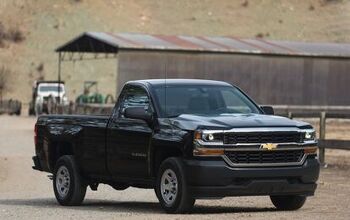
General Motors’ 2-percent drop occurred not only because of harsh declines from key cars but also because light trucks couldn’t make up for the passenger car decline. Sales of the Chevrolet Equinox fell 10 percent, the Chevrolet Silverado was down 4 percent, and GMC Sierra volume slid 8 percent. GM says the automaker’s U.S. retail volume is up 1.3 percent through the first-half of 2016.
The worst percentage losses in 2016’s first-half took place at Bentley and Smart, but among volume brands, the 19-percent decreases at FCA’s Fiat and Chrysler brands were the most severe. Among the most notable increases, the discontinued Scion brand, the reviving Jaguar brand, the resurgent Volvo brand, and the perpetually strong Jeep brand’s gains are strongest.
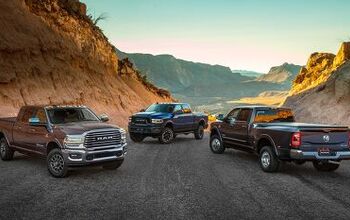
Auto BrandJune 2016June 2015% Change2016 YTD2015 YTD% ChangeAcura 11,35215,527-26.9%78,99487,087-9.3%Alfa Romeo 3625 44.0% 309320-3.4%Audi 18,44518,2621.0%96,93493,6153.5%BMW 28,85532,176-10.3%153,436168,623-9.0%Buick 16,57517,531-5.5%104,207106,314-2.0%Cadillac 14,26313,5155.5%73,23180,899-9.5%Chevrolet 181,387181,2560.1%1,006,8901,053,619-4.4%Chrysler 24,74730,809 -19.7%137,372170,248-19.3%Dodge 44,81943,457 3.1%271,740257,1425.7%Fiat 2,5443,137 -18.9%17,73521,798 -18.6%Ford 230,287 216,355 6.4% 1,291,873 1,241,207 4.1%GMC 42,98547,051-8.6%254,587264,713-3.8%Honda 127,363118,8707.1%713,361665,9147.1%Hyundai 67,511 67,502 0.0% 374,060371,1500.8%Infiniti 11,058 9,985 10.7% 64,97864,2801.1%Jaguar 2,743 1,217125%10,9917,83640.3%Jeep 83,69171,529 17.0%468,131401,68916.5%Kia 62,57254,137 15.6%328,327310,952 5.6%Land Rover 5,7054,64322.9%36,64832,312 13.4%Lexus 25,77926,121-1.3%151,564158,848-4.6%Lincoln 8,8098,3265.8%53,29747,11213.1%Maserati 941974-3.4%5,1995,304-2.0%Mazda 26,18827,223-3.8%145,354158,995-8.6%Mercedes-Benz ° 28,47328,044 1.5% 162,777 164,966 -1.3% Mercedes-Benz Vans ° 3,0852,442 26.3% 15,762 13,534 16.5%Total Mercedes-Benz ° 31,55830,4863.5%178,539178,5000.0%Mini 4,9146,174-20.4%25,14430,260-16.9%Mitsubishi 8,0237,9630.8%51,93449,5444.8%Nissan 129,495 114,243 13.4%733,136 672,203 9.1%Porsche 4,4824,2236.1%26,70825,1386.2%Ram 41,236 36,078 14.3%256,972230,94611.3%Scion 6,1793,83861.0%37,72024,93151.3%Smart 407774-47.4%2,5933,624-28.4%Subaru 46,59844,3355.1%279,458272,4182.6%Toyota 166,299179,953-7.6% 1,008,516 1,047,661-3.7%Volkswagen 23,80930,436-21.8%149,014174,442-14.6%Volvo 8,4545,98541.3%36,52029,36624.4%————— ——BMW-Mini 33,76938,350-11.9%178,580198,883-10.2%Fiat Chrysler Automobiles 197,073185,0356.5%1,152,2591,082,1436.5%DaimlerAG31,96531,2602.3%181,132182,124-0.5%Ford Motor Co. 239,096 224,6816.4% 1,345,169 1,288,319 4.4%General Motors 255,210259,353-1.6%1,438,9151,505,545-4.4%Honda Motor Co.138,715134,3973.2%792,355 753,0015.2%Hyundai-Kia 130,083 121,639 6.9% 702,387 682,1023.0%Jaguar-Land Rover 8,4485,86044.2%47,639 40,14818.7%Nissan Motor Co. 140,553 124,228 13.1% 798,114 736,4838.4%Toyota Motor Corp.198,257209,912-5.6%1,197,800 1,231,440-2.7%Volkswagen Group * 46,88053,144-11.8%273,284294,444-7.2%———————Industry Total †1,512,9961,476,9192.4% 8,642,2848,525,7391.4%Source: Manufacturers
[Image Source: American Honda]
* Volkswagen Group includes sales figures for Audi, Bentley, Porsche, and Volkswagen brands
° Mercedes-Benz USA releases sales figures for the Mercedes-Benz brand in the conventional sense, vans excluded, as well as totals for the Metris and Sprinter vans. The complete picture is included here.
† Industry total takes into account Automotive News figures/estimates for brands such as Tesla (2,250 June units) and other low-volume, high-priced manufacturers; total does not yet include Porsche.
Timothy Cain is the founder of GoodCarBadCar.net, which obsesses over the free and frequent publication of U.S. and Canadian auto sales figures.
More by Timothy Cain


Comments
Join the conversation
Congratulations to Jaguar and Volvo for getting back into the car business. After almost 2 years of Maserati either beating or coming close to Jaguar sales its good to see them move up to the upper fringes of luxury car sales. For many years Volvo was the best selling European car brand and they should be on track to selling over 100,000 cars in the U. S. for the first time in a number of years. It looks like the new XC90 is making a serious impact.
None of this changes the fact that JLR are growing faster than Lincoln in Lincolns own back yard. How many cars did Lincoln shift in Europe last year? Selling JLR was daft. The numbers prove it.