


Chart Of The Day: Cars Do Better Than Buses For Fuel Economy?
Published: February 20th, 2015
Share
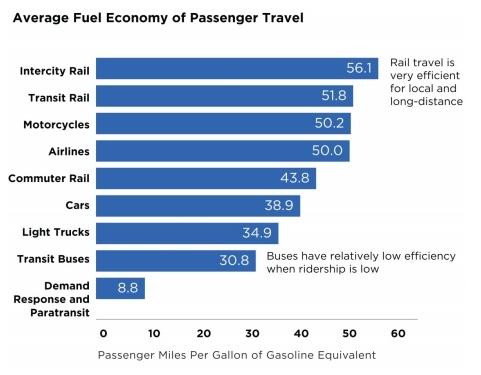
A new chart from the Department of Transportation claims that taking the bus is actually less fuel efficient than driving a car or light truck. I’ll grab the popcorn while you read this and mull over Ronnie’s piece on EVs.
Hat tip: Glenn Mercer
More by Derek Kreindler


Comments
Join the conversation
50 mpg/pm on a motorcycle? I must be having too much fun.
When I wrote an article a few years ago looking at different policies for mitigating global warming, two transportation experts in the US and one in Europe told me that installing public transportation was an extremely expensive way to mitigate global warming, and not worth it for that goal. (They did say there were other reasons to do it.) http://ehp.niehs.nih.gov/117-a296/
Ohhh a chart from "The Department of Transportation" Impressive! What Department of Transportation would that be from? The US DOT? The North Dakota DOT? The Canadian DOT? What is the chart measuring? Inner city ridership at 3 AM? 500 mile intercity trips? What are the metrics used to measure ridership and MPG? With no link to the source it's impossible to determine anyting. Clearly since Glenn Mercer, a "freelance automotive industry investment adviser" posted this on Twitter it MUST be true and indicative of...something! With such artful non information surely a position with a p̶r̶o̶p̶a̶g̶a̶n̶d̶a̶ lobbying outfit awaits Mr. Kreindler. FWIW: http://d35brb9zkkbdsd.cloudfront.net/wp-content/uploads/2013/09/kwan_fig1a-300x257.png No, I know none of the details of the chart I linked to above, but I think it's purty, and it does show transit in a much better light then Mercer's chart, Derek. Here is another link, a 26% delta between the best and worst airlines (and if you read the fine print, upto an 87% delta between airlines serving the same route). http://www.theicct.org/sites/default/files/U.S.%20Airlines%20Ranking%20Fact%20Sheet%20final.pdf Can't wait for your next piece of bait, Derek. Perhaps something on the Kallikak family? Others besides me have made this point Derek: People on on mass transit are people out of cars. If mass transit were absent then more roads would be required, especially in dense urban areas where roads are the most costly to build. Such expense will result in higher road usage fees, and/or less money for rural, exurban, and suburban roads. I did like the Golf R review however!
This could be partially fixed by using smaller buses, methinks. In my city, they use these giant, full-size buses that I've never seen more than 3 passengers on. They could use a conversion van, instead!