Chart Of The Day: U.S. Auto Market Share – November 2014
Compared with the previous month, November 2014 saw smaller automakers pick up market share at the expense of America’s largest automobile manufacturers. General Motors and Ford Motor Company combined to lose nearly a full percentage point in November even as the Volkswagen Group, Subaru, and Daimler AG combined to equal that in terms of gains.
Question Of The Day: Are Small Crossovers Stealing Midsize Sales Because Of Fuel Prices?
After climbing above $3.50/gallon for much of the spring, the average U.S. retail price for regular gasoline began to decline in mid-July before rapidly plunging throughout the fall of 2014, sliding to around $2.70/gallon by the beginning of December.
Have consumer tendencies been altered as a result?
We’re not on a mission to suggest they have, nor is our aim to support the belief that they haven’t. Any change would be both slight and gradual, and not without other possible causes. (Indeed, if it is slight, it means the vast majority of buyers aren’t changing their ways at all.) But if there is a band of consumers which makes new vehicle purchase decisions based on a brief period of less costly fuel, how many consumers are in such a band, and how different is the new track they follow?
Chart Of The Day: Gas Prices, Trucks And Automobiles
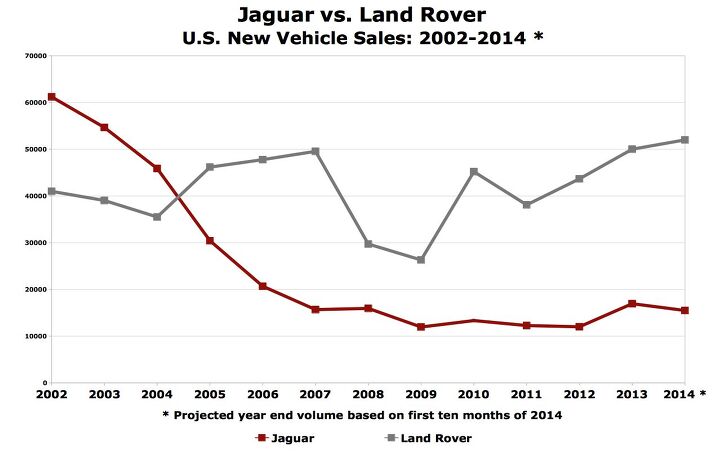
Chart Of The Day: Jaguar Vs. Land Rover
The reasons for the drop of the red line and the steady rise of the grey line on today’s chart are perhaps too numerous to count.
Additional product for one brand. Less intervention at another.
A move toward high-riding vehicles helped one brand. A move away from traditional cars harmed the other. These two factors are made all the more apparent when one brand employs a full lineup of SUVs/crossovers and the other has yet to bring its first utility vehicle to market.
One brand’s message has been artfully constructed over a few decades; the other’s has been muddied for at least a generation.
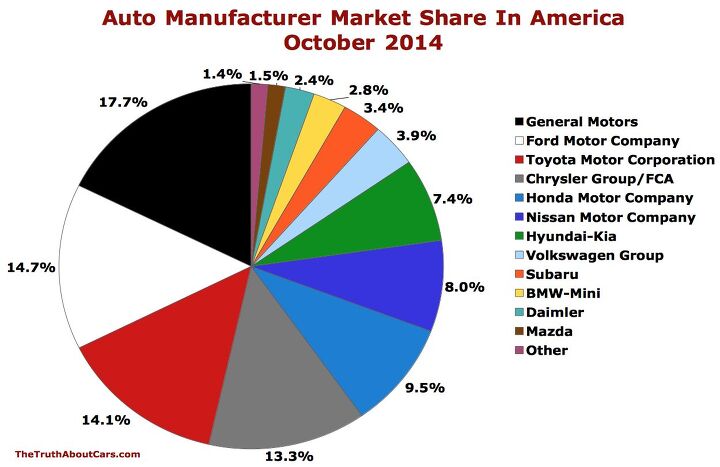
Chart Of The Day: U.S. Auto Market Share – October 2014
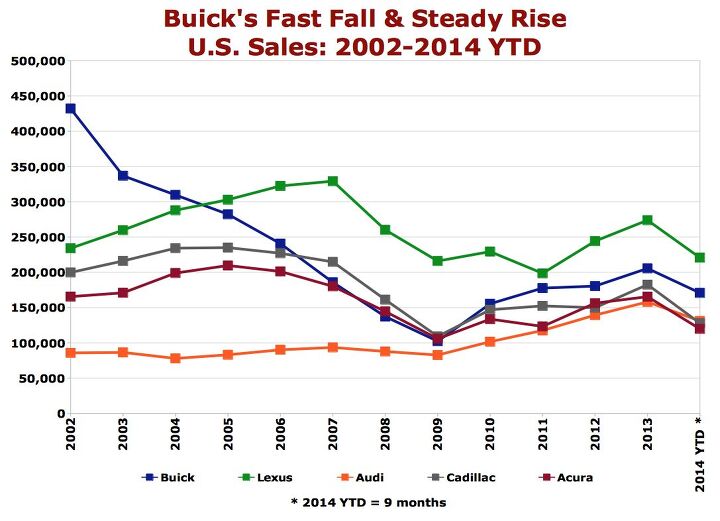
Chart Of The Day: Buick's Fast Fall And Steady Rise
Through the first nine months of 2014, U.S. Buick volume is up 8% to 170,764 units, nearly 50,000 sales back of Lexus, sales of which have risen 16%. Though Buick, the 19th-best-selling auto brand in America, trails Lexus, the 18th-best-selling brand, by a wide margin, Buick has opened up a wide lead over America’s three next-best-selling brands, Audi, Cadillac, and Acura.
Chart Of The Day: The 200 And A Decade Of Chrysler Group Midsize Car Sales
Through the first nine months of 2014, sales of the Chrysler 200 are down 27%. That’s to be expected, as the 200 was transitioning from Sebring-based (but Pentastar-powered!) fleet favourite to sleeker 2015 200 form. Granted, Toyota is transitioning from Camry to refreshed Camry and sales are up 5% this year, but that’s a somewhat invalid comparison for another day. Dodge Avenger volume is down 37% to 49,363 units in 2014, but again, this was an anticipated decline, as Chrysler Group has actually killed off the Avenger.
Jointly, the duo is down 31% to 124,505 units. For the third time, this is not a shocker. We expected a period of decreasing 200 volume, and we knew the Avenger’s drops were going to be severe.
Chart Of The Day: What Are America's Leading Automakers Selling?
American consumers are on pace to buy and lease more new vehicles in 2014 than at any point since 2007, if not earlier. The seven largest automakers in the United States generate 77% of the market’s volume. For each of those seven, this chart breaks down the vehicle categories where their volume is created.
For Hyundai and Kia, this means 77% of their sales are generated by traditional passenger cars, and 37% of their own car volume with the Sonata and Optima. At Ford Motor Company, 30% of their U.S. volume is derived from pickup truck sales, the F-Series lineup. At the Chrysler Group, minivans are responsible do 14% of the load-lugging.
Chart Of The Day: U.S. Auto Market Share - September 2014
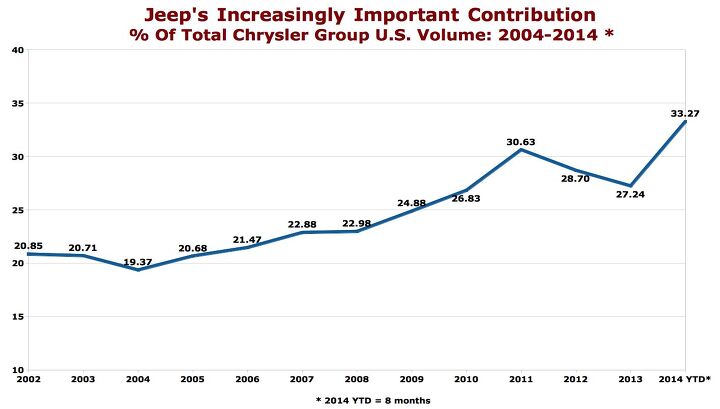
Chart Of The Day: Jeep's Importance At FCA In America
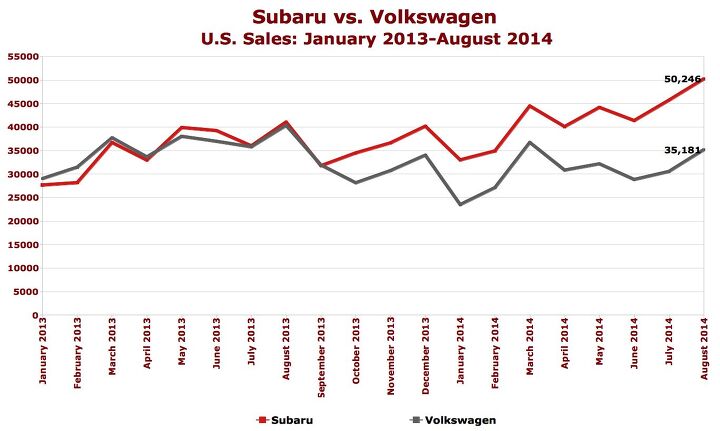
Chart Of The Day: Subaru Vs. Volkswagen
It’s not a brand new thing, this Subaru-besting-Volkswagen trend. But when Subaru outsold the Volkswagen brand in the United States in 2009 and 2010, Subaru was on a rapid upswing despite the market’s sharp decline, and all auto sales results were thought to be skewed by the recession.
Chart Of The Day: U.S. Minivan Market Share In 2014
Minivan sales in America have grown 6% this year even as last year’s top seller, the Honda Odyssey, has suffered a 4.5% year-over-year volume decline. A slight uptick in Toyota Sienna volume has helped, but decreased sales from the Nissan Quest and now-cancelled Mazda 5 haven’t helped.
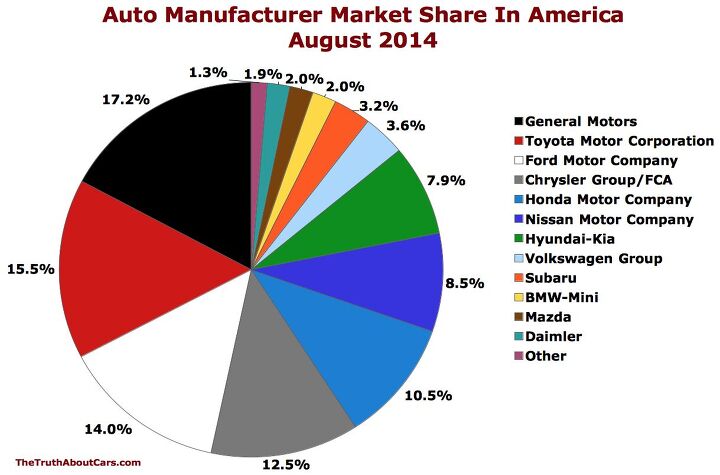
U.S. Auto Market Share – August 2014
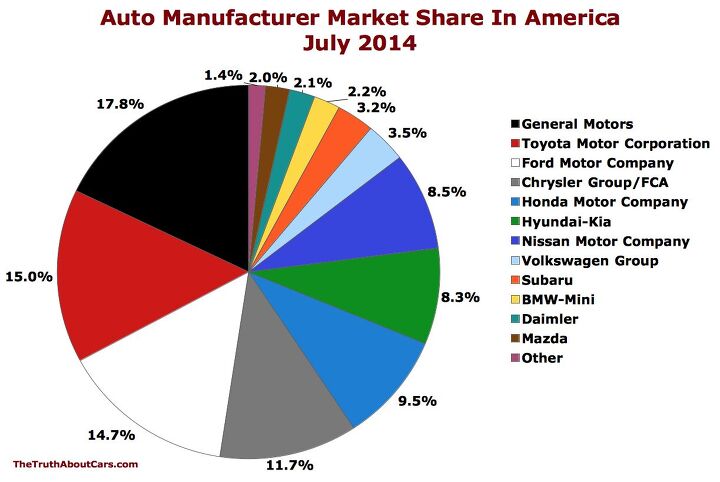
U.S. Auto Market Share – July 2014
Chart Of The Day: Crossovers Are King
This chart, courtesy of IHS Automotive, shows that for the first time in America, crossovers have edged out sedans as the most popular body style.
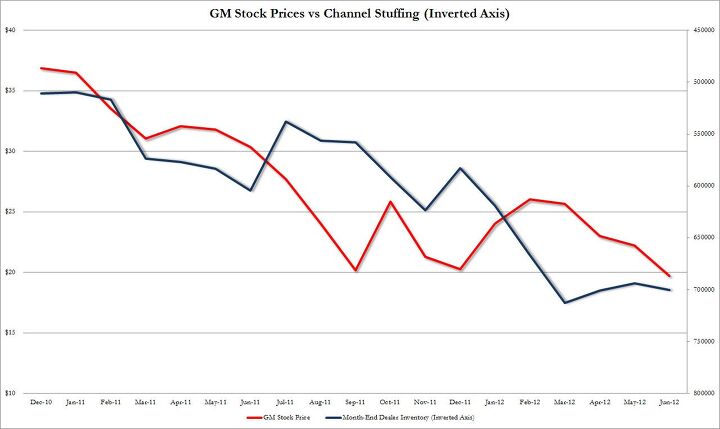
Chart Of The Day: Channel Stuffing Bonanza
Today’s Chart comes from finance blog Zero Hedge, which has taken a periodic interest in General Motors channel stuffing endeavors. While we don’t normally report on stock prices here at TTAC, this one is worth mentioning.
Chart Of The Day: The Rise And Fall Of The Chevrolet Cruze
Ever since emerging from bankruptcy, the Chevrolet Cruze has been something of a symbol of GM’s rebound. Widely hailed by the automotive media as General Motors’ strongest effort to date in a compact segment that has become increasingly important in recent years, the Cruze seemed to show that the “new” GM was capable of selling smaller cars on their merits, rather than as afterthoughts to more profitable truck, SUV and large car offerings. And indeed, through the first half of this year, it seemed that the Cruze was something of a roaring success, regularly outselling its segment competitors. But then, in June, when production shifted from 2011 models to 2012 models, something changed: sales started to slow, and inventories started to rise. As Cruzes began piling up on dealer lots, GM trimmed production moderately, but still, inventories began to grow out of control. Clearly something was going wrong.
UPDATED: “Big Six” compact sedan monthly sales graph (Jan-Nov, 2011) added to gallery after the jump.
Chart Of The Day: The Truth About Vehicle Fires Edition
I’ve suggested in these pages that the several documented fires involving Chevrolet Volts suggest some kind of pattern, as no other major-manufacturer EVs have been involved in any reported fires. But, as Ronnie Schreiber at Cars In Depth points out, even that pattern seems to pale in comparison to the National Fire Protection Association’s tally of highway vehicle fires in the US each year. Though the number of highway vehicle fires has decreased significantly since 1980, 2009 still saw 190,500 fires. And between 2003 and 2007,
On average, 31 highway vehicle fires were reported per hour. These fires killed one person a day.
Chart Of The Day: Lexus Core Models (Plus Luxury/Premium Brands) In 2011
With today’s chart showing the abject failure of Lexus’s HS250h, we thought we’d dig deeper into Lexus’s 2011 performance by breaking out the brand’s core model sales over the year. And, to be perfectly honest, they don’t look as bad as you might expect. Though the tsunami-related supply shortages cut a huge hole out of Lexus’s sales this year, the overall momentum model-by-model doesn’t seem as bad as I might have thought, given that Lexus is the most-stumbling brand of the year, sales-wise. And, to give a little more context to this focused at Lexus’s portfolio, we’ve included a chart of year-over-year performances through October of all the luxury/premium brands.
Volt Production Drops Slightly As Export Volume Ramps Up And Dealers Sell Demonstrators
With all the attention being paid to Volt sales, production and turn time in the wake of recent congressional criticism, I thought I’d update our recent chart of Volt sales versus production to see how GM’s wonder car is doing a month on. As you can see, there’s not much obvious change on the year-to-date chart, with both sales and production trending upwards. But if we zoom in on the most recent months, we can see something strange happening…
Chart(s) Of The Day: Is Subaru's Sales Streak Losing Steam?
Sales analysis for calender-year 2011 hasn’t been easy, as supply disruptions in Asia have caused sales dips that may not be related to actual market demand. So, it’s not entirely surprising that Subaru’s sales numbers seem to be drooping this year, after two years of spectacular sales growth. Indeed, the brand’s sales releases make much of its inventory woes, although Subaru USA’s Thomas Doll still insists that
Based on the continuing strong demand for our products, increased supply through December and the launch of the all-new Impreza we expect to finish 2011 with the fourth consecutive year of sales growth for Subaru.
And he may be right (note: our estimate of declining 2011 volume above is non-seasonally-adjusted). In fact, through October, Subaru was less than 1% off its pace for the previous year’s sales through October. On the other hand, if you look at Subaru’s sales over the last 18 months, you’ll find that not all of its sales slippage can be blamed on the tsunami….
Chart Of The Day: Compact Cars In October And Year-To-Date (Bonus Edition!)
With October’s compact segment numbers reflecting the midsized segment’s return to the Toyota-Honda duopoly, the year-to-date graph shows that 2011 saw the rise of a new contender in the compact class: Chevy’s Cruze. With “ virtually zero” 2012 Civics at Honda’s dealers (allegedly) due to Earthquake aftermath and Thai flooding, it’s beginning to look like Civic could be kicked out of the new triumvirate, leaving Cruze and Corolla to fight it out to the finish. To celebrate the drama, we’ve included a special bonus graph showing the “Big Six” compact horserace from January through October, to go along with the YTD graph. Enjoy!
Chart Of The Day: Midsized Sedans In October And Year To Date
The import empire struck back last month, as Honda and Hyundai jumped in segment sales and Chevy’s Malibu got battered down towards the bottom of our monthly chart. Four of the top five midsized sellers in October were import nameplates, although the two biggest year-over-year growers were Chrysler’s 200 and Kia’s Optima. Meanwhile, VW’s Chattanooga-built Passat is still rolling out, but still managed to post 5,000 units in its first month. Year-to-date rankings remain unchanged from last month, although Accord could easily squeeze past Fusion to snag third place by year’s end.
Chart Of The Day: Brands That Are "Losing" 2011
The auto sales game has only one rule: sell more cars this year than you did last year. By that measure, these seven brands are “losing” 2011 as we head into the final two months of the year. Of course 2011’s king of bellyflopping brands was Mercury, which went from 78,656 units in the first 10 months of 2010 to 248 in the same period this year. But because it was mercifully euthanized by Ford (not to mention the fact that its 99.7% decline ruined the rest of the graph), Ford’s erstwhile “entry luxury” brand has been left off.
And what we’re left with is a sight to behold… the once-dominant Honda and Toyota (and even their luxury brands) laid low by floods, tsunamis, congressional hearings and a few poorly-received products. Even Subaru, a brand that grew 15 and 16 percent in 2009 and 2010 respectively seems in danger of not growing its volume this year… for less easily-explained (or is that superficially-explained?) reasons. Meanwhile, if Jaguar is falling behind with its freshest lineup in… well, you get the point. With the market up 10% compared to where it was in the first ten months of 2010, nobody wants to be losing volume right now…
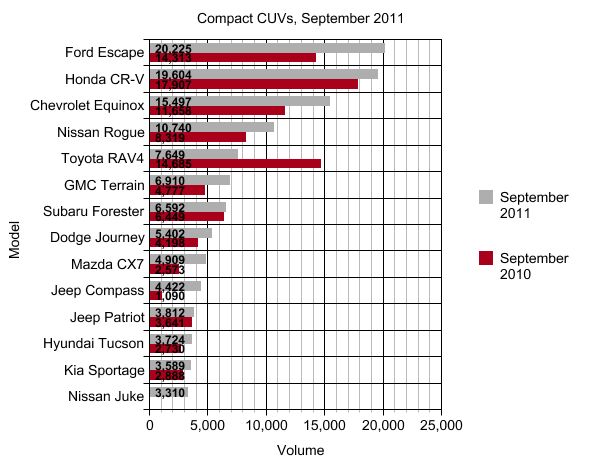
Chart Of The Day: Compact CUVs In September And YTD
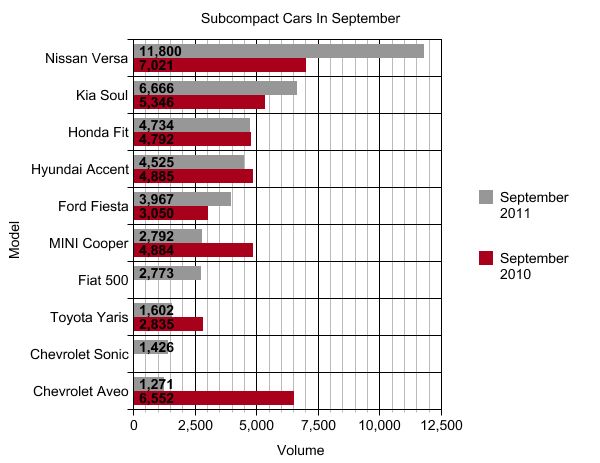
Chart Of The Day: Subcompact Sales In September And Year-To-Date
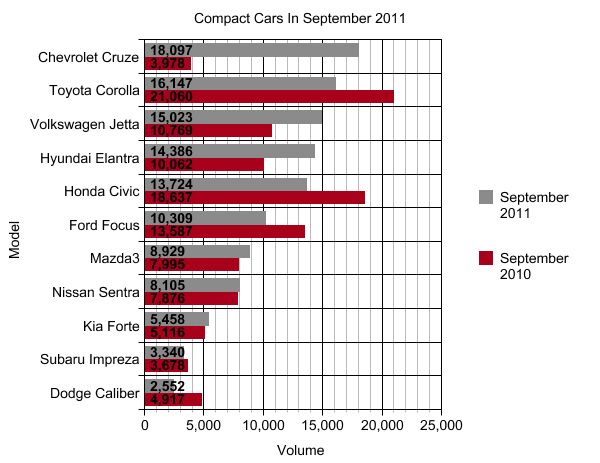
Chart Of The Day: Compact Cars In September
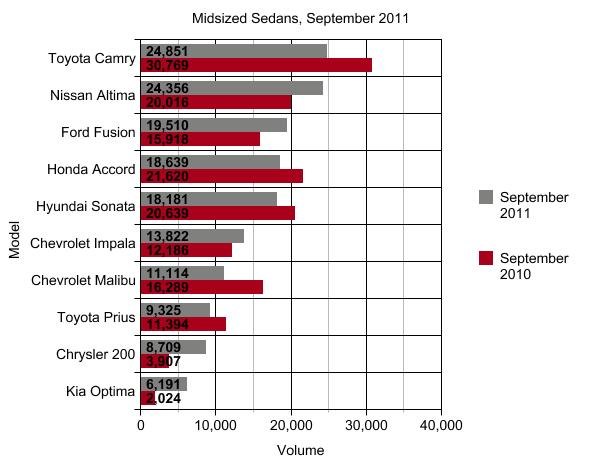
Chart Of The Day: Midsized Sedans In September And Year-To-Date
Chart Of The Day: The Chevrolet Volt's Sales Challenge
Is the Chevy Volt a flop? It’s a question that plenty of folks both inside the industry and beyond seem awfully curious about, and one that I’ve tried to stay away from until we had some strong data to go on. And with nine months of 2011 under our belt, we’re starting to get a sense of where the Volt is going… and it’s not been all reassuring news. Jalopnik notes that such unloved GM models as the Buick Lucerne and Chevy Avalanche outsold the Volt last month, but failed to look at the important stuff: production as compared to deliveries, and inventory. Jalopnik does quote a Cars.com inventory figure of 2,600 Volts on dealer lots, although the latest data we have from Automotive News [sub] shows 1,400 units in the national inventory as of September 1… which at that point constituted a 121-day supply. Add in the 1,644-unit differential between Volts built and Volts sold in September, and the estimated Volt inventory across the nation should be closer to 3,000 units. We will be sure to update when AN gets new inventory numbers, but for now, the signs aren’t promising.
Chart Of The Day: Auto Industry Approval Rating Bounces Back
Approval rating, based on the question “Do you think each of the following generally do a good or bad job of serving their consumers?”
Auto industry rejoice: you are no longer as despised as the banking industry! Harris Polls didn’t release data for the years 1999 and 2010 exaggerating some of the swings you see in this graph, but it’s safe to say the auto industry has clawed its way out of a post-bailout PR hangover. Sure, Big Auto is still trailing such glamorous industries as Online Retail and Packaged Food, and only barely beat Electric and Gas Utilities for the hearts of consumers… but after nearly falling into negative approval numbers in 2009, this is still a big comeback. And compared to the industry that Big Auto is most closely tied to, namely Big Oil, even 2009 was a “what PR problem?” kind of a year. Which is more than a little strange when you think about it…
Wild-Ass Rumor Of The Day: After The Ridgeline, Honda Considering An Even Smaller Pickup?
In a blog item bemoaning the likely imminent death of the Honda Ridgeline, Automotive News [sub] Product Editor Rick Kranz accuses Honda of “abandoning” its funky pickup by failing to update its styling or hardware since it was introduced in 2005. His point seems to be that the Ridgeline was a decent enough niche product that withered on the vine… and the sales numbers certainly seem to support that thesis. But if you compare Ridgeline to other Japanese-brand compact-midsized pickups, you find that Toyota and Nissan saw similar drops in volume over a similar time period… as did practically all non-full-size pickups. So could Honda have done more for the Ridgeline, or was its decline inevitable? While you’re pondering that mystery, consider this: Kranz points to the last sentence of a months-old piece for one of those zombie rumors that never really got any play:
Based on conversations with industry sources, the story said a smaller pickup is under consideration, derived from the CR-V platform.
Presuming less payload and towing capacity than the Ridgeline, I can’t imagine why a smaller pickup based on a front-drive platform would be a more successful product formula for Honda.
On the other hand, a CR-V-based pickup is something that hasn’t been tried for decades in this market… and it wouldn’t compete nearly as directly with the cheap full-sizers that are killing the “compact” (actually midsized) pickups. So, is Kranz’s logic sound, or could a CR-V-based pickup mix up the market? Faith springs eternal for me when it comes to efficient utility vehicles… but what say you?
Chart Of The Day: Midsized Sedans In August And YTD
NB: Chrysler 200 sold 3787 in August 2010, and Kia Optima sold 1714.
Well, it’s that time again TTAC fans: the Midsized wars roll on with Camry retaking the top spot to extend its advantage in YTD sales. Altima continued its consistent year with a second place showing, and improving over its August 2010 number better than any nameplate besides… the Chrysler 200? Yes, Chrysler’s updated Sebring stopgap outsold the freshly-chic Optima on the month, and passed it in YTD sales. Meanwhile, the Hyundai Sonata may still have been 10k off the Camry’s pace, but its August volume was a mere 37 units from tying Mazda6’s YTD volume (through August). All in all though, this wasn’t an incredible month for midsizers, as half of the best-selling nameplates failed to improve on their year-over-year numbers. But what this segment lacks in volume growth it makes up for in drama, as a falling Accord runs the very real risk of being passed by Malibu and Sonata. Camry may be back in control, but the fight for the rest of the podium is as tight as ever.
Chart Of The Day: The 25 Best-Selling Nameplates Of August
Well, you’ve seen a complete chart of sales by manufacturer and brand… now it’s time for some nameplate results. Here are your top-25 best-selling nameplates for August 2011. And yes, the Honda Civic barely made the list…
Chart Of The Day: The Toyota Camry Index
As Camry-fest rolls on, we found an interesting little chart over at Edmunds Autoobserver, which shows that this latest Camry has the lowest inflation-adjusted MSRP in the model’s history. Amid all the talk of record-high transaction prices, Toyota obviously thinks MSRP still matters, as Autoobserver reports
The current-generation Camry has a theoretical build of 1,246 combinations. The 2012 Camry will be available in a startlingly meager 36 combinations, because consumers have told Toyota they want a simpler ordering process… There will be four trim packages from which to choose, and despite the significant improvements in the model, any 2012 Camry will be priced close to or less than a comparably-equipped 2011.
The 2011 Camry L, the base model produced in very low volume and sold almost exclusively to fleets, starts at $20,195. The new 2012 Camry L will start at $21,995 (plus $760 for destination), the core 2012 Camry LE package for comfort and value will be priced at $22,500. The sportier Camry SE, currently priced at $22,965, will start at $23,000. The premium trim package Camry XLE ($26,725 for MY 2011), will start at $24,725, a $2,000 reduction. Toyota notes that comparably equipped, prices for all trim levels have dropped.
So, even though you need fewer inflation-adjusted dollars than ever before to buy a base Camry, very few of those models will be built. Toyota may be talking value, but in this market you need to shout it…
Chart Of The Day: Mid/Large CUV Sales In July And Year To Date
Sales of all car-based crossovers continue to climb, far outstripping demand for body-on-frame utes as well as pickup trucks. But strangely enough, a lot of the growth and volume among crossovers is in the compact-CUV segmen t, where the top-selling model last month beat July’s mid/full-CUV winner by some 10,000 units. This suggests that The Great American Downsizing, as we’ve called it, isn’t as simple as former SUV owners replacing their BOF beast with one of these comparable mid/full-CUVs. Still, this is an important segment because although the stakes aren’t wildly high, the competition is fierce. GM won by a whisker last month, but Ford’s got a strong one-two punch as well with its Explorer/Edge combo. Meanwhile, Honda’s Crosstour and Ford’s Flex have bombed all the way off our monthly volume chart. Hit the jump to find out their Year-To-Date numbers, and to find out who the somewhat surprising YTD volume winner is.
Chart Of The Day: Subcompacts In July And Year To Date
In contrast to rapid changes in the compact and midsized segments, the subcompact segment is moving along established trendlines. Kia’s Soul has completely overtaken this segment’s previous champ, but that’s been a long time coming. A new Accent is arriving at dealers, and that model’s starting to take off… in fact, if there’s news here, it’s that the Accent appears to be outselling the segment’s next-freshest offering, the Ford Fiesta. Otherwise, Aveo and Rio are dropping off ahead of their replacement by new models, the 500 is getting closer to MINI’s monthly volume, and Mazda2 can’t quite get past the Cube The YTD chart doesn’t show too many changes either… but watch this space as the A/B segment heats up with new models later this year.
Chart Of The Day: Compact Crossovers In July And Year-To-Date
Domestics rule the compact crossover segment this month, with the ageless Escape standing above the crowd (albeit without weighting for fleet sales). Again, Honda and Toyota show bigger drops than Nissan’s Rogue, reinforcing the perception that Nissan has done a remarkable job recovering from the tsunami. Intriguingly, Jeep’s Patriot is essentially flat year-over-year, while the Compass has bounced back on the strength of its redesign… but only to about the Patriot’s rate. Meanwhile, Hyundai has yet to find the disruptive success in this segment that it’s enjoying in the C- and D-sedan segments.
Midsized Wars: The "Big Six" Sedans, 1995-2010
With signs of change appearing in the midsized segment, I thought we would look at our archived sales results for the “Big Six” sedan nameplates in hopes of some historic context. And here it is: competitive convergence is turning what used to be Toyota and Honda’s wading pool into a bloody knife fight.
Chart Of The Day: Midsized Sedans In July And Year-To-Date
Like yesterday’s Compact chart, today’s look at the midsized (D) segment shows either profound changes afoot or a lingering tsunami hangover, depending on how you look at it. Accord, Prius and Camry were the biggest year-over-year losers last month, although the Malibu also lost a small amount of volume as well. Nissan, which has clearly weathered the tsunami aftermath better than its competition, took advantage and added to the Altima’s volume. But once again, the changes look less profound when you look at YTD numbers, with Camry remaining on top by a healthy margin, Altima and Fusion close behind, and Honda falling just out of the top three. Meanwhile Chrysler’s midsizers just barely beat the Prius… in combined volume. Yikes! [NB: Optima’s July 2010 volume (which is invisible in the codger-friendly chart above) was 1,857]
Chart Of The Day: Compact Cars In July And Year-To-Date
Chevy’s Cruze dominated the compact segment last month, racking up a 7k unit advantage over its next-closest rival, the Corolla. Corolla and Civic were the two biggest losers year-over-year, as tsunami related supply issues hold them back. Civic even dropped to sixth in its class, while Jetta (which could almost be classified as midsized) and Elantra snuck past it and towards the falling Corolla. Mazda3 beat Sentra, which in turn beat the Forte… so all in all, a strange month for a class that seemed to be lacking a real leader in the early months of this year. But if you look at the YTD numbers in the second chart (see gallery below, sadly not in “old codger-friendly” format), you’ll find that the Corolla is hanging onto first (for the moment), Civic is about 6k units behind the second-place Cruze and Elantra in fourth place. So there’s some familiarity left in the class that was once ruled by the Corolla and Civic… but don’t expect it to last too much longer, unless a lot of people are simply waiting for their Japanese brands to get restocked. In any case, the competition has never been more fierce.
The 25 Best-Selling Vehicles Through July
Honda, long a fixture in the upper reaches of rolling YTD sales charts, has been well and properly knocked off its pedestal by now, with its best-seller, the Accord, just barely making it into the top ten at number nine. Civic came in at 11th, while CR-V was 14th. And Honda’s not the only long-reigning volume champ that’son its way down: compared to last year, Toyota’s Corolla and Camry have shed about eight percent of their volume, and right below them the Altima and Fusion are both growing at around 17.5%. By the end of this month, Toyota could easily have only one vehicle in the top five (and could even be knocked out altogether), Honda could be completely out of the top ten, and Ford, Chevy and Nissan could be dominating the upper reaches of our YTD chart. Ch-ch-ch-changes…
[UPDATE: Old Codger-friendly version in gallery below]
Chart Of The Day: The "Big Six" Midsized Sedans In 2011
A year ago I put together a chart comparing the first-half performance of America’s “big six” most popular midsized sedans. Then, the graph seemed to show promising growth and a tightening segment. Now we seem to be looking at an up-and-down but ultimately more stagnant market… and a segment that is still battling it out in some of the closest competition in recent memory. But this chart alone doesn’t tell the whole story… hit the jump for the same chart, only with sales plotted cumulatively by month.
Market Share In The First Half Of 2011
In the battle for market share, Detroit is making something of a comeback. After decades of decline, the unprecedented taxpayer investment in Detroit seems to be yielding dividends in the form of solidifying signs of recovery. Of course, these firms still have a long ways to go before they’re done reversing their long declines, and the turnaround has doubtless been fueled by temporary phenomena like the Toyota recall and the Japanese tsunami. Still, these are some of the first big-picture signs of a serious change in fortunes for Detroit, and deserve the attention of market watchers (graphs can be found in the gallery after the jump, along with a graph of June and Y-T-D market share).
The 25 Best-Selling Vehicles In The First Half Of 2011
While I was celebrating my independence from TTAC on a camping road trip through the wilds of Eastern Oregon this weekend, it seems that quite a little debate was stirred up by Bertel’s publication of the top 10 best-selling American-market cars in June. In hopes that more information will lead to a stronger debate, I’m dedicating a good chunk of my Independence Day to an overview of the American car market in the first half of this year, starting with this chart of the top 25 Year-To-Date performers. I’ve omitted year-ago numbers in the interests of chart cleanliness, but a snapshot of last Summer’s sales studs can be found here. The contrasts are… well, I’ll let you fill in that blank. With the exception of incentive and fleet sales mitigation, the numbers speak for themselves…
June Sales: Steady As She Goes
2011 started promisingly enough, with sales soaring above a 13m unit SAAR for the first four months of the year. Halfway through the year, however, what looked like a solid recovery is proving to be less than entirely reliable, as SAAR looks to drop below 12m units for the second month in a row. While the macroeconomists fight over whether this mid-year stumble is a sign of fundamental weakness or minor hiccup in a strong market “backstopped” by a seemingly endless “pent up demand,” it’s time for us to look at the sales numbers from each firm. Check back regularly as we update our developing table of sales, and be sure to watch for more mid-year sales analysis as we get a handle on who is best positioned to take advantage of the market, whether 2011 proves to be an up, down, or sideways year.
Chart Of The Day: Global Sales Growth Slows To A Crawl
According to Wards Auto, global auto sales through May hit 32.62 million units, up 6.0% from the year-ago number. But as the chart above shows, the rate of growth in global deliveries has slowed dramatically over the past year-and-a-half, falling below five percent the last several months. So what’s the problem? At this point, what isn’t the problem? The US and Japan have been hit hard by the Japanese tsunami, while the once-blistering-hot markets of China and India are shrinking and growing more slowly respectively.
Collectively, markets in the Asia/Pacific region accounted for 2.35 million vehicle deliveries, equating to 37% of world sales, the region’s lowest global market share since May 2009.
In the U.S. and Canada, sales of Japanese vehicles slipped precipitously below the rest of the market in May due to supply shortages, pulling North America’s year-over-year performance 2.3% below like-2010 on a volume basis, despite an 11.7% increase in Mexico.
So where’s the good news? After a forgettable few years, Europe is back… and South America is staying strong.
Overall deliveries in Europe rose 14.2% in May, to 1.85 million units. The resulting 29.2% share of world sales was the region’s highest take since June of last year…
Double-digit growth in many of South America’s smaller markets lifted regional sales in May 27.6%, compared with year-ago, for a 7.9% share of global deliveries – a 9-month high.
Chart Of The Day: The Pony Car Wars In 2011
What is there to say about this chart? Mustang had a shot… it coulda been a contender… but Camaro was just too busy building momentum, en route to what should be the nameplate’s best volume year since 1995. Challenger, meanwhile, just seems stuck spinning its wheels in third place. Oh, and since this chart has little in the way of controversy, let me just add this: if Hyundai starts breaking out its Genesis Coupe sales when it launches a muscle car-inspired facelift for the model, we would love to see how that underdog story plays out. In the meantime, though, Genesis coupe and sedan combined barely touch the Challenger’s volume… at this point pony cars are still very much an American game.
Chart Of The Day: Compact Class Turmoil In May
Honda and Toyota have been valiantly holding off an all-out assault on the compact segment thus far, and Civic and Corolla still lead the C-segment’s year-to-date sales race. FOr the month of May, however, the barbarians made it inside the gate, and turned the compact market on its head. Chevrolet’s Cruze, which was one of the first of new breed of compacts to launch, took advantage of its head-start in the marketplace to tear into first place, beating the new Focus by a mere 408 units. Elantra was about 2k units behind the Focus/Cruze leaders, but finished nearly 2k units ahead of Civic, which itself beat Corolla by nearly 1,500 units. Now that the Compact Wars are well and truly joined, we can expect more of this back-and-forth each month. In any given month this can be anyone’s segment… the question now is whether Honda and Toyota can possibly hang onto their YTD lead and finish 2011 with the volume win. It’s by no means a sure thing… hit the jump for a month-by-month breakdown of “big six” compact sales.
Chart Of The Day: The Top 25 Best-Selling Nameplates Through May
OK boys and girls, we’re working on our last month of the first half of 2011… and it’s time for a gut-check. Here are the studs of the light-duty vehicle sales world, the top 25 total volume sellers in the US through May. But remember, we have no fleet sales breakouts by model (data donations accepted at our contact form)… so this isn’t necessarily a measure of the cars that are selling best with private consumers. Still, it’s an interesting list of cars, with a surprise for everyone (RAV4 barely beating Prius, for starters). We hope you enjoy it.
The Most And Least Died-In Vehicles Of 2006-2009
Forget crash test results, star ratings, or the number of acronym-laden electronic nanny systems that a vehicle has. If you’re a play-it-by-the-numbers kind of person and want to know safe a car is, statistically speaking, you’ll want to check out the Insurance Institute for Highway Safety’s new status report on “Dying In A Crash” [ PDF]. The latest data comes from the 2006-2009 period, and includes only 2005-2008 model-year vehicles with at least 100,000 “registered vehicle years” in that time frame (if a vehicle was substantially redesigned in 2005-08, only the most recent design is included). Also,
researchers adjusted for a variety of factors that affect crash rates, including driver age and gender, calendar year, vehicle age, and vehicle density at the garaging location. Previously, researchers had adjusted only for driver age and gender.
“The adjusted driver death rates do a better job of teasing out differences among vehicles, but they can only go so far. For one thing, people don’t behave the same when they’re behind the wheel of a sports car as when they’re driving a minivan. And some people are more susceptible to injury and death for reasons that can’t completely be adjusted for.”
Keep in mind that this data is for drivers only, since passenger data is harder to adjust for. Also, statistics don’t determine your safety on an individual level… that’s up to you every time you take the wheel. For more caveats (and the complete list), check out the report itself… or just wave this in front of your friends and family members who drive cars on the “highest rates of driver death” list, and hyperventilate at them. They’ll either thank you or tell you to take your nannyish concern elsewhere.
What's Wrong With This Picture: A Month Of Mass-Market Madness Edition
Yes, ladies and gentlemen, the “Detroit Three” automakers are once again on top of the charts, as a wild and wacky month of sales closed with some serious shifts in the volume-manufacturer landscape. Not only did Chrysler claw its way back to number three for the month, but Hyundai-Kia beat out all the Japanese competition save Toyota, which narrowly escaped with the top non-Detroit volume number. Detroit fans should savor the win, as the Japanese automakers should work through most of their inventory and supply issues by sometime this summer. Things should get back to (relatively) normal at that point, but for now it’s clear that literally anything is possible.
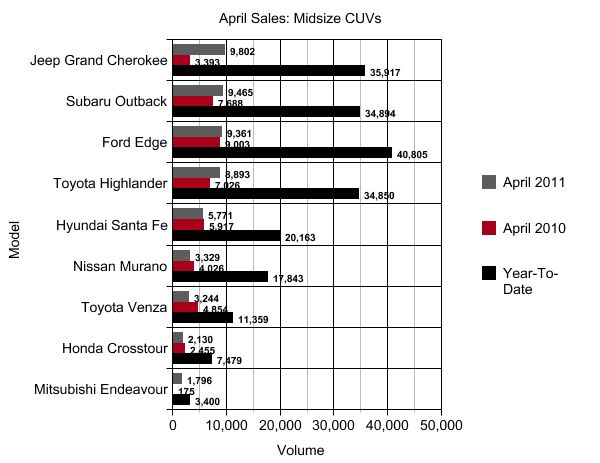
April Sales: The Crossover Report
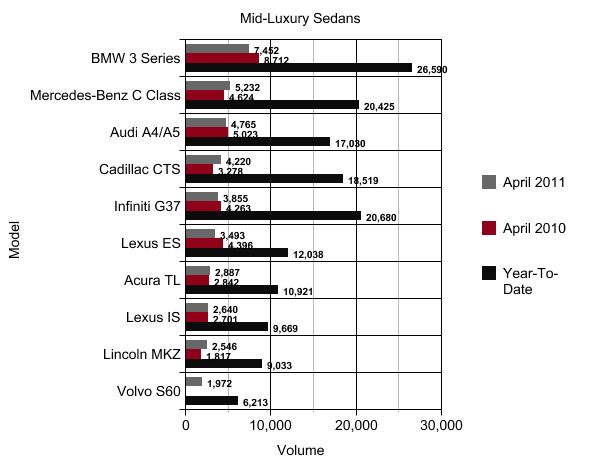
April Sales: Mid and Large Luxury Sedans
BMW’s Dreier continues to be the dominant force in the smaller “mid-luxury” segment, while archrival Mercedes controls the large luxury segment (chart after the jump) with its E Class. But the bigger story? Lexus’s incredible vanishing act, with both the ES and IS drooping under the German onslaught. Cadillac’s CTS beat the Audi A4 sedan, but add the A5 in (as the CTS, 3-Series and G37 all include coupes) and the Caddy drops to fourth place for the month. Ultimately, though, the Mercedes, Audi, Cadillac and Infiniti may switch places month-by-month, but all four are clearly stuck vying for the role of best 3-Series alternative. Meanwhile, the large luxury sedan market would thrill for even that level of competition…
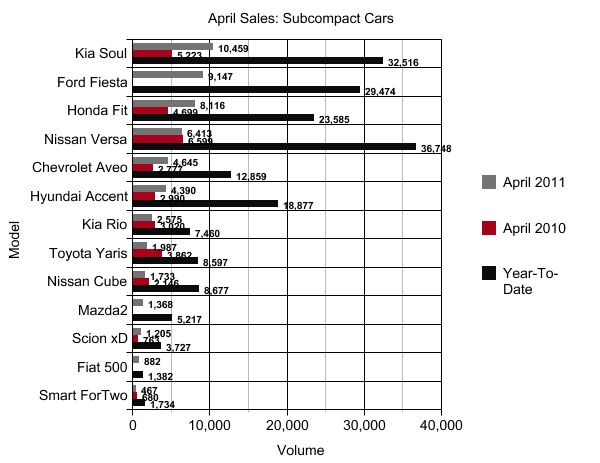
Sales: Subcompact Cars, April 2011
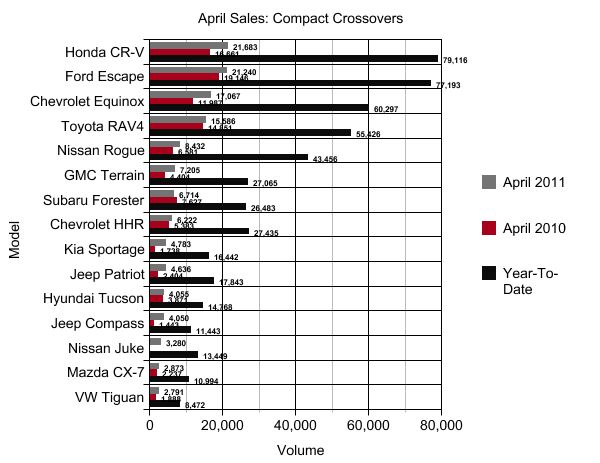
April Sales: Compact Crossovers
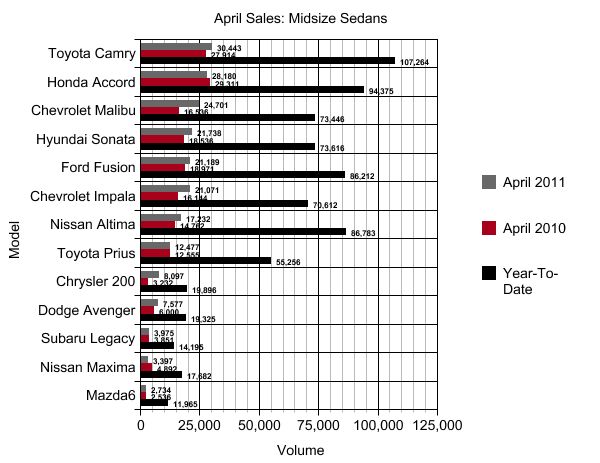
April Sales: Midsized Sedans
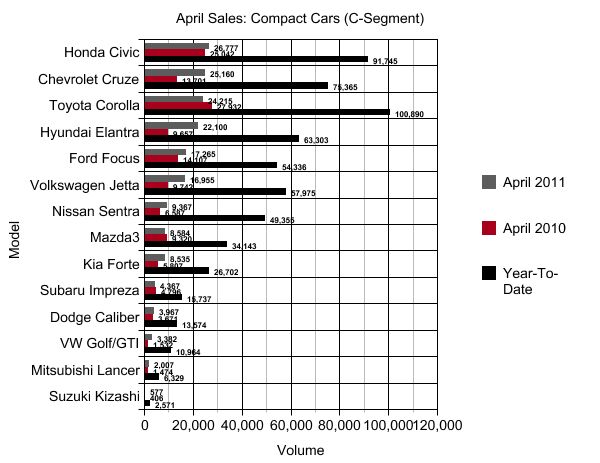
Chart Of The Day: Compact Wars Heat Up In April
Chart Of The Day: Why Have Road Fatalities Declined?
The chart [above] shows the rate of fatalities per 100 million miles driven. We have assembled the data, going back almost 100 years. Look at the chart closely. Can you see a drop in fatalities that corresponds with when seatbelts were first introduced? Or when legislation mandating their use was passed? Or what about when air bags become prevalent? What about a jump in fatalities that ties to the current “epidemic” in texting while driving?
I can’t. The data does show that fatalities dropped markedly during the Great Depression and WW II. Aside from that, the rate has been declining steadily for years. Decades, even. This is good news, but makes it hard to credit seatbelts, technology or the other factors that reflexively are given credit. I am not suggesting that we should all stop wearing seatbelts. I am suggesting that when thinking about transportation safety, there is more going on than we typically consider.
Chart Of The Day: Does The EcoBoost F-150 "Fail" At Fuel Economy?
Bringing out a V6 version of a full-size truck like the F-150 is a good way to get truck guys suspicious, especially if you try to assuage their fears by talking about the engine’s direct-injection, turbocharging and other high-tech frippery. Ford’s solution: emphasize the “power of a V8, efficiency of a V6” simplification, and hope the market catches on as gas prices rise. But does Ford’s marketing concept actually hold true in real life? Does an Ecoboost F-150 get the mileage of a six cylinder even when doing tough truck-guy work? Thanks to some great work by Pickuptrucks.com, you can decide for yourself using the data from a fantastic infographic used to illustrate their test of a loaded and unloaded Ecoboost F-150.
Chart Of The Day: GM's Monthly Retail Market Share, 2008-2011
Retail market share is one of those metrics that tends to cut through the vagueness of pure sales-volume numbers, reflecting an automaker’s performance compared to the competition, without the distraction of fleet sales. It’s not a perfect measure of a business’s overall strength, as fleet sales can help with economies of scale and capacity utilization, but it’s one of the most accurate ways to measure the appeal of a firm’s products with real consumers. And, based on this chart of GM’s monthly retail market share (as calculated by TrueCar VP for Industry Analysis and all-round data ninja Jesse Toprak), GM’s much-vaunted Lutz-era products aren’t moving the needle with those real consumers. Emerging from bankruptcy didn’t seem to provide much of boost either. And unless drastic happens soon, GM’s battle for consumer acceptance will continue its slow but steady decline. Not good!















Recent Comments