


U.S. Auto Sales Brand-By-Brand Results: February 2017 YTD

Auto sales declined by a modest 1 percent in the United States in February 2017, dragged down by plunging sales at numerous Fiat Chrysler Automobiles brands and sharp declines at Toyota Motor Corp. and Hyundai-Kia. Ford Motor Company sales slid 4 percent because of a 26-percent decline in car sales at the Ford division.
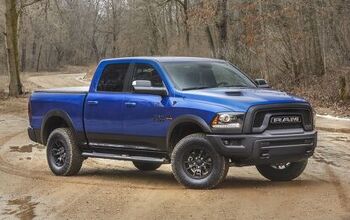
Across much of the industry, there were signs of rude health, particularly if the car sector is ignored. Of the 20 most popular cars in America — a group topped by the Toyota Camry — 16 nameplates generated fewer sales this February than last. Yet America’s five leading utility vehicles (Rogue, CR-V, RAV4, Escape, Equinox) combined for more than 25,000 additional February sales in 2017. And while minivan sales plunged by a fifth, U.S. pickup truck sales were up 10 percent because of full-size truck strength.
These stark contradictions produced a market that produced slightly degraded numbers in one of the two traditionally weakest months on the calendar. Now one-sixth of the way into 2017, the poor selling season should be behind us.
Mercedes-Benz led all premium auto brands in February 2017. Lexus, typically a top contender for luxury leadership, posted a harsh decline for a second consecutive month following a December surge.
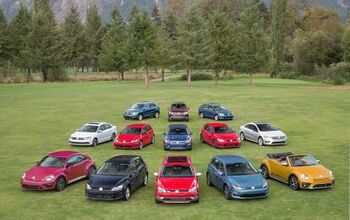
Mitsubishi was the fastest-growing mainstream brand, rising 39 percent year-over-year. Infiniti, Audi, GMC, and Volkswagen all reported double-digit percentage increases, along with niche brands like Maserati, Jaguar, Bentley, and Alfa Romeo, which sold 412 Giulias.
On the flip side, Chrysler, Mini, and Lexus all reported declines of more than 20 percent.
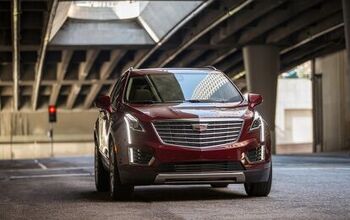
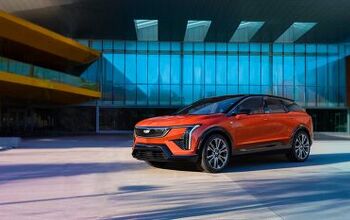
America’s largest-volume automaker, meanwhile, rose 4 percent. GM sales improved thanks to meaningful gains at Chevrolet and GMC, despite drops at Buick and Cadillac.
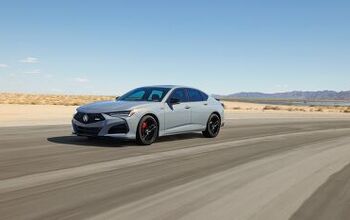
Auto BrandFebuary 2017February 2016% Change2017 YTD2016 YTD% ChangeAcura 10,86412,773-14.9%20,06623,023-12.8%Alfa Romeo44347 843%551115379%Audi 13,74111,71817.3%26,94223,56814.3%BMW 22,55822,4980.3%40,66740,5800.2%Buick 16,13117,811-9.4%29,24836,080-18.9%Cadillac 10,82311,840-8.6%21,12122,580-6.5%Chevrolet 164,095158,6443.4%299,265296,4471.0%Chrysler 16,73023,279 -28.1%30,10745,051-33.2%Dodge 43,87846,985-6.6%83,98795,287 -11.9%Fiat 2,1452,651 -19.1%4,3095,030-14.3%Ford 198,720208,006-4.5%361,121373,307-3.3%Genesis 1,582——3,400——GMC 46,33939,53017.2%83,66376,4639.4%Honda 110,822106,2124.3%208,000196,4595.9%Hyundai 51,438 53,009 -3.0%96,12798,020-1.9%Infiniti 13,73710,37132.5%25,29518,88533.9%Jaguar 3,4841,512130%6,4232,864124%Jeep 62,34573,063 -14.7%120,760135,830-11.1%Kia 42,67349,737-14.2%78,29988,042-11.1%Land Rover 5,7476,417 -10.4%11,91012,072-1.3%Lexus 18,33823,090-20.6%33,91044,023-23.0%Lincoln 8,7448,0398.8%17,52915,21615.2%Maserati 1,08772849.3%1,9761,25357.7%Mazda 22,82421,5445.9%44,52241,2487.9%Mercedes-Benz °24,522 22,941 6.9% 50,049 47,605 5.1% Mercedes-Benz Vans °2,513 2,269 10.8% 4,562 4,168 9.5% Total Mercedes-Benz °27,03525,2107.2% 54,611 51,7735.5%Mini 2,1542,839-24.1%5,2646,077-13.4%Mitsubishi 10,9247,870 38.8%17,38114,13423.0%Nissan 122,003120,5401.2%222,764217,7602.3%Porsche 3,6373,561 2.1%8,2397,9154.1%Ram 42,78541,293 3.6%80,83077,3574.5%Smart 348422-17.5%672821-18.1%Subaru 45,50042,0118.3%89,37983,1127.5%Toyota †156,001164,864-5.4%283,477305,214-7.1%Volkswagen 25,14522,32112.7%48,65542,40014.8%Volvo 4,6515,260-11.6%8,1239,504-14.5%————— ——BMW-Mini 24,71225,337-2.5%45,93146,657-1.6%Fiat Chrysler Automobiles 168,326187,318 -10.1%320,544358,670-10.6%DaimlerAG27,38325,6326.8%55,28352,5945.1%Ford Motor Co.207,464216,045-4.0%378,560388,523-2.6%General Motors 237,388227,8254.2%433,297431,5700.4%Honda Motor Co.121,686118,9852.3%228,066 219,48223.9%Hyundai-Kia 95,693102,746-6.9%177,826186,062-4.4%Jaguar-Land Rover 9,2317,92916.4%18,333 14,93622.7%Nissan Motor Co./Mitsubishi146,664138,7815.7%265,440250,7795.8%Toyota Motor Corp.174,339187,954-7.2%317,387 349,237-9.1%Volkswagen Group * 42,67837,66213.3%84,139 74,02613.7%———————Industry Total †1,333,128 1,348,401 -1.1% 2,475,700 2,512,864 -1.5%Source: Manufacturers
* Volkswagen Group includes sales figures for Audi, Bentley, Porsche, and Volkswagen brands
° Mercedes-Benz USA releases sales figures for the Mercedes-Benz brand in the conventional sense, vans excluded, as well as totals for the Metris and Sprinter vans. The complete picture is included here.
† Toyota’s sales figures include those of Toyota’s discontinued Scion brand.
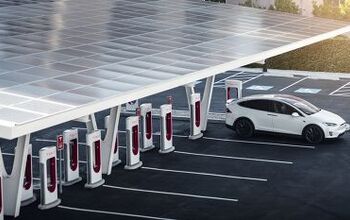
** Industry total takes into account Automotive News figures/estimates for brands such as Tesla (3,000 February units) and other low-volume, high-priced manufacturers.
Timothy Cain is the founder of GoodCarBadCar.net, which obsesses over the free and frequent publication of U.S. and Canadian auto sales figures.
More by Timothy Cain


Comments
Join the conversation
Is there somewhere with a more detailed breakdown? I would love to know sales by model.
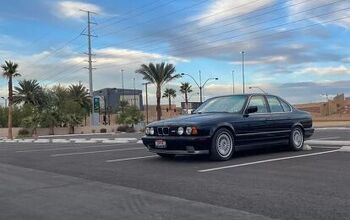
Jaguar up 130% and nipping at Porches heels, yay!