


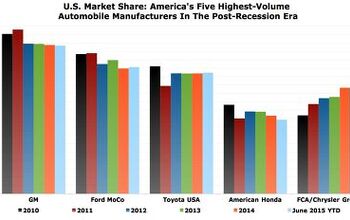
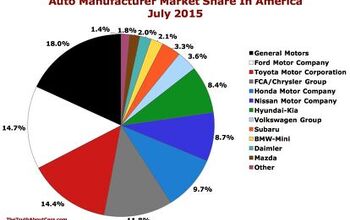
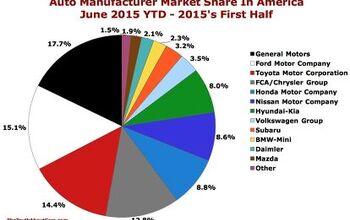
Chart Of The Day: What Are America's Leading Automakers Selling?
American consumers are on pace to buy and lease more new vehicles in 2014 than at any point since 2007, if not earlier. The seven largest automakers in the United States generate 77% of the market’s volume. For each of those seven, this chart breaks down the vehicle categories where their volume is created.
For Hyundai and Kia, this means 77% of their sales are generated by traditional passenger cars, and 37% of their own car volume with the Sonata and Optima. At Ford Motor Company, 30% of their U.S. volume is derived from pickup truck sales, the F-Series lineup. At the Chrysler Group, minivans are responsible do 14% of the load-lugging.
Select from the dropdown menu at the top left of the chart to cycle through the seven largest automakers.
Timothy Cain is the founder of GoodCarBadCar.net, which obsesses over the free and frequent publication of U.S. and Canadian auto sales figures.
More by Timothy Cain


Comments
Join the conversation
Why would anyone pick a sedan? The per mile costs area little over half a full-sized pick-up. Naturally, there's some wiggle room in these numbers. Compare a $25,000 mid-level optioned car and a $40,000 mid-level optioned truck. Trucks used to depreciate much more slowly than cars. That's less true today.
I'm seeing an error, not a chart...
Cross referencing this data with the earlier story about efficiency/emissions really makes one wonder about the difference between Nissan and Honda, while explaining the FCA results there rather succinctly. Nissan is more car less truck than Honda, and still can't match the efficiency. FCA is CUV and SUV dominated like no other mentioned automaker, so being last in CO2 emissions makes sense.
"For Hyundai and Kia, this means 77% of their sales are generated by traditional passenger cars..." Given the market shift to trucks and SUVs, you wonder how long Hyundai / Kia can continue to grow with their current product mix?