


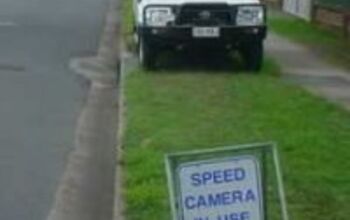
Australia: Speed Camera Deployments Examined

The auditor general for New South Wales, Australia last month issued a report on speed camera use in the state. The Liberal Party government had ordered the review after it took power at the end of March. Following the results, thirty-eight camera locations have been taken offline.
As with the like-minded Conservative Party in the UK, NSW Liberals did not set out not to end the use of photo enforcement which generated 371,015 tickets worth $58,117,038 last year. Instead, the party’s leaders are taking steps reduce the number of cameras and reverse the ruling Labor Party policies that kept safety, operational and revenue data for individual cameras a closely guarded secret. No effort had been made to evaluate the program since 2005.
Auditor-General Peter Achterstraat set out to answer whether speed cameras were located in areas identified as having greatest road safety risk and whether the number of crashes were reduced following their installation. Achterstraat pronounced the system a success.
“Overall speeding and crashes reduced after the introduction of fixed speed cameras,” Achterstraat wrote. “The results are mixed when examining individual cameras, with crashes decreasing at some locations but not at others.”
The audit’s formal definition of a “successful” speed camera location included those places where there was no change in the number of accidents at all. The analysis found that 141 fixed speed camera locations, only 40 had statistically significant accident reductions, 38 had increases and 63 saw no significant change. This distribution of variation in crash rates is consistent with the assumption that cameras have no effect at all.
The audit looked at three years of data before and three years after, even though most of the cameras have been in place for at least eight years. In the US, the fatal accident rate has dropped significantly over time without significant speed camera use. According to the National Highway Traffic Safety Administration, there were 1.09 fatalities per 100 million vehicle miles traveled last year, down from the 1.13 fatality rate for 2009 — the lowest rate since 1949. The rate was 1.73 in 1994.
Achterstraat noted that one out of five speed camera citations are issued to drivers exceeding the speed limit by 6 MPH or less for a $90 fine, but this did not mean that the cameras were set up to be a monetary trap. Seventy-three percent of tickets went to those accused of driving between 7 and 12 MPH over the limit for a $211 fine. The maximum speed camera fine in NSW is $1987.
“We found no evidence that potential revenue is a factor in decisions on where cameras are located,” Achterstraat wrote. “Some [members of the public] sought to break the nexus between speeding and revenue-raising by suggesting abolishing monetary fines for speeding and replacing them with non-monetary sanctions…. All of these suggestions would impact on the revenue to government and therefore on the level of services that government could fund.”
[Courtesy: Thenewspaper.com]
More by The Newspaper


Comments
Join the conversation
I really think you need to find a better source for your news. This article contains some major factual errors in reporting evident with only a quick skim of the actual report. 1. "Instead, the party’s leaders are taking steps reduce the number of cameras and reverse the ruling Labor Party policies" The Labor Party is no longer the ruling party, I presume they meant to say "the former Labor government policies" or similar. 2. "The audit’s formal definition of a “successful” speed camera location included those places where there was no change in the number of accidents at all." Page 23: "Definition of an effective fixed speed camera An effective camera must meet one of the following criteria: • have less casualties, the same or less number of crashes, and no fatalities when comparing three years before and after installation" For brevity I have omitted the other 3 criteria, given this criterion contains the phrase the author has based the statement on. No change in number of accidents is not sufficient to make the location "successful", the statement is misleading. Without reviewing the whole report or base data, I could suggest a reason why some cameras would have had an increase in crash numbers - the roll-out of school speed zones (25mph) in 2001-2003. Observance of these limits is generally low and the subsequent difference in speeds would be a factor in accidents. It would be unusual for speed cameras to have been installed in these locations prior to the introduction of the school speed limits. 3. "The audit looked at three years of data before and three years after, even though most of the cameras have been in place for at least eight years." Page 21 contains a graph showing average number of crashes and fatalaties/injuries at speed camera locations for 3 years prior and 10 years since camera installation. Pages 28-36 contain graphs of 8 years worth of data on speeding fines issued (number, speed band, location). As an aside, all speed bands have trended strongly downwards (these cameras have multiple billboard-size signs leading up to them after all) for all bands except >45km/h over the speed limit. Page 38 contains a small listing of crash data (injury/fatality & total) for a selection of cameras for 3 years prior and 8 years since installation. I am not sure why the comparison with the fatality rate in the US was made - particularly as it is not a favorable one! In 1995, two years prior to the introduction of the first fixed speed cameras in NSW, the fatality rate was 1.95 per 100 million vehicle miles, while in 2008 (most recent year I can find data) the rate was 0.91 - a much larger reduction. While I am not personally a fan of speed cameras, and have made a few "voluntary tax contributions", it is pretty clear that they have had an overall positive effect on road safety. The report acknowledges their role in tunnels etc where police cannot patrol, for example. In my state it is very noticeable that the average speed of traffic is a lot closer to the limit than it was 20 years ago. Instead I think that teaching new drivers how to drive a car properly is still not being addressed properly and much more important to road safety. There isn't a formal training requirement, only simple theory & practical tests - getting a forklift license to drive in a comparatively controlled environment is much more arduous. Apologies for the long comment!