


Opinion: Flaws in Insurance Institute Traffic Camera Study, Part 2

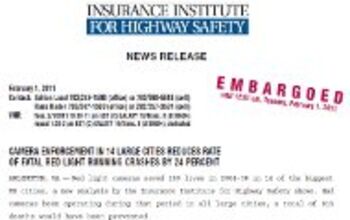
The Insurance Institute for Highway Safety spent all of yesterday touting its report on the effectiveness on red light cameras as if it were the most “comprehensive” study available on the topic. The group emphasized the effects cameras would have had on one hundred of America’s largest cities, but the report itself only looked at accident numbers in fourteen out of the 500 jurisdictions that have active photo ticketing programs. Industry researchers did not even know how many red light cameras were in use in the locations studied.
“Attempts were made to obtain historical information on the number of red light cameras in the study cities, but information on the scope of red light programs could not be obtained for many of the cities,” the IIHS study explained (page 9).
By comparison, a 2005 study by the Federal Highway Administration (FHWA) gathered data from fifteen cities that used automated enforcement. The study’s final results excluded eight of these locations because it was not possible to obtain complete accident reports, signal timing data, traffic flow numbers and other variables — twenty-eight in total. While the FHWA study suffered from its own methodological flaws, the government agency considered reporting results without detailed data to be unscientific.
“Exposure is the major determinant of intersection crashes,” the FHWA study explained. “Therefore, it is important to account for any changes between the before and after period, particularly if these changes are triggered by the measure. All studies reviewed have failed to do this accounting, conveniently assuming that red light cameras will not change exposure.”
IIHS did not bother gathering data regarding any of the factors FHWA considered essential, aside from looking up 1990 and 2000 population figures. In fact, the insurance industry relied upon the eight-year gap between the “before” and “after” periods to obtain the desired result. In locations like Chandler, Arizona the community went through significant changes — including the building of the Loop 101 and Loop 202 freeways — during this time. These new routes drew traffic away from intersections during the “after” period despite the increase in population. Without accounting for the change in traffic volumes, the figures would be misleading. Chandler accounted for the greatest decrease in citywide accidents in the IIHS report. IIHS not knowing which locations in the city had cameras could not check whether there was a difference between camera and non-camera locations.
A professor at the University of Illinois at Chicago did check and determined last year that there was no statistical difference before and after the cameras were installed in the Windy City. The data refuted the IIHS assumption that there is a so-called “spillover” or “halo” effect that spreads good driving habits throughout the photo-enforced jurisdiction. Between 2001 and 2008, use of cameras had no effect on the percentage of accidents that took place at intersections — the figure remained steady at about 25 percent ( view report). IIHS claimed big accident reductions in Chicago, and in Baltimore, Maryland. The latter city last month reported inconclusive results from its photo ticketing program.
“Six of the 15 locations had more traffic accidents in 2010 compared to prior years, and eight of the 15 locations had fewer traffic accidents in 2010 compared to prior years,” the Baltimore County report explained. “One location had the same number of traffic accidents.”
As mentioned in Part One of this analysis of the IIHS report, the Insurance Institute is primarily the public relations arm of the automobile insurers that rely upon ticketing programs to increase annual premiums. Anne T. McCartt, senior vice president for research, was one of the three researchers who coauthored the report. Her doctorate is not in engineering but from the Rockefeller School of Public Affairs, which offers degrees only in public administration or politics — the perfect preparation for a career in manipulating the media to advance public policy.
A copy of the IIHS report is available in a 500k PDF file at the source link below.
Effect of Red Light Camera Enforcement (Insurance Institute for Highway Safety, 2/1/2011)
[Courtesy: Thenewspaper.com]
More by The Newspaper


Comments
Join the conversation
The study may as well have been partly underwritten by Redflex and ATS.