So the total cars sold in the US will be between 10-12 MM at best. Likely more like 8MM.
Shocking, been saying that since 2008.
How r-tarded are people?
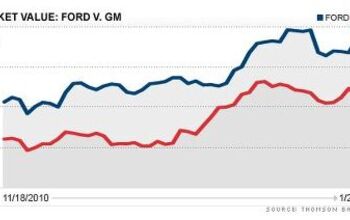
Knowing this site I think this may be a "trick" graph.
How do you define dometic vs. imported cars? Do you mean American brands vs. foreign brands? Or all cars built in this country vs. cars built in other countries, regardless of brand?
I can't vouch for how "trick" (and by "trick", I assume you mean "deceptive"), but I'm assuming this is by name plate and not by country of origin. As far as the general car buying public is concerned, a Honda is Japanese whether it was assembled in Japan or Ohio, a VW is German whether it was built in Germany, Brazil or Mexico, and a Chevrolet is American whether it was assembled in the U.S., Mexico, Canada or Korea.
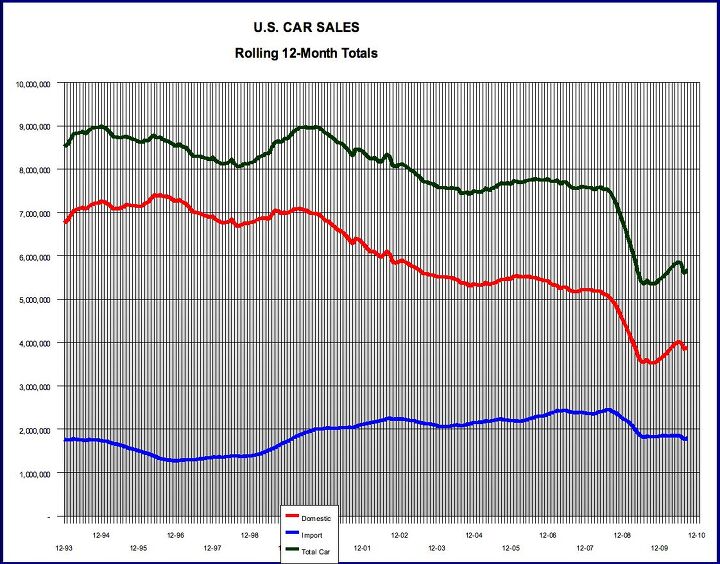
Without more specifics on the makeup of the imports category, the most informative part of this chart is the total sales line which has been trending relentlessly downward. As overall vehicle quality improves, the need to replace cars just keeps going down and the consumer is less swayed by marketing to needlessly "upgrade". The over-capacity in the industry is not going to get sopped up by increased demand, and the fight to get a bigger slice of a shrinking pie is going to get tougher and tougher.
CCG, the total sales line is tracking the domestic car total pretty closely. The import sales are about where they were in 1993, with a dip in the '90s and a pickup in sales after the dot-com bust.
This is CAR sales, and the imports have the CRV and RAV, Pilot and Highlander adding margin to profits. The domestics started dropping when SUV/CUV popularity boomed during the housing boom, along with trucks from the big three.
What's notable is the bigger drop by the domestics when the Great Recession started in '08. The imports dropped a lesser amount to their '93 level, but the domestics are seeing 1940 levels. The graph doesn't show that truck sales have dropped 20-25% since 1999, but it does show that domestic car sales have dropped 40-45%, dragging down the overall car sales.
So what I see is the drop in domestic car sales constituting the majority of the drop in the overall car market. America is falling out of love with American cars.
I'm not surprised as even with the wife and I having what currently seems to be two stable jobs, the last thing I want is a fat five year new car loan in uncertain times. Of our three vehicles, two are paid off, and the third one is a Honda, and Honda is already sending me letters begging me to trade it in for a new one. No thank you!


Comments
Join the conversation
So the total cars sold in the US will be between 10-12 MM at best. Likely more like 8MM. Shocking, been saying that since 2008. How r-tarded are people?
Knowing this site I think this may be a "trick" graph. How do you define dometic vs. imported cars? Do you mean American brands vs. foreign brands? Or all cars built in this country vs. cars built in other countries, regardless of brand?
Without more specifics on the makeup of the imports category, the most informative part of this chart is the total sales line which has been trending relentlessly downward. As overall vehicle quality improves, the need to replace cars just keeps going down and the consumer is less swayed by marketing to needlessly "upgrade". The over-capacity in the industry is not going to get sopped up by increased demand, and the fight to get a bigger slice of a shrinking pie is going to get tougher and tougher.
I'm not surprised as even with the wife and I having what currently seems to be two stable jobs, the last thing I want is a fat five year new car loan in uncertain times. Of our three vehicles, two are paid off, and the third one is a Honda, and Honda is already sending me letters begging me to trade it in for a new one. No thank you!