TTAC's NHTSA Data Dive: 95 Cars Ranked In Rate Of Unintended Acceleration Complaints

[Update 3: This post is now officially obsolete, having been supplanted by the much more accurate update here]
[Update 2: In a new post, I have noted that 53% of Toyota UA complaints were filed after the mat advisory was issued on 9/29/09. The number used her are not adjusted for that. As soon as they are available, I will redo this spreadsheet, using more accurate sales stats]
[Update ans Disclaimer: As I noted below, this spreadsheet will be updated when I can access actual sales stats from our source, Morgan and Co. on Monday for the years (’05-’10) covered. That will very likely change the rankings somewhat. The Lincoln may actually be #2. But this is not about which car is #1 or it’s about finding patterns in certain makes, and within makes. It’s an attempt to see if these statistics can shed light on a complex and opaque issue. As an example, why the Toyota Yaris is so low in reported incidents. It’s more about these patterns and discrepancies, than about singling out the car with the highest rate, so please don’t take the current exact rankings as the final word. It’s a work in progress. The fact that the complaints are not tabulated by individual MY also limits this substantially, as running changes in a given car during the five year period will change things significantly. So this data dive is fundamentally flawed; take it as such. But nevertheless, it’s still a huge step over the raw data that Edmunds put out, which doesn’t begin to account for the number of any given cars sold.]
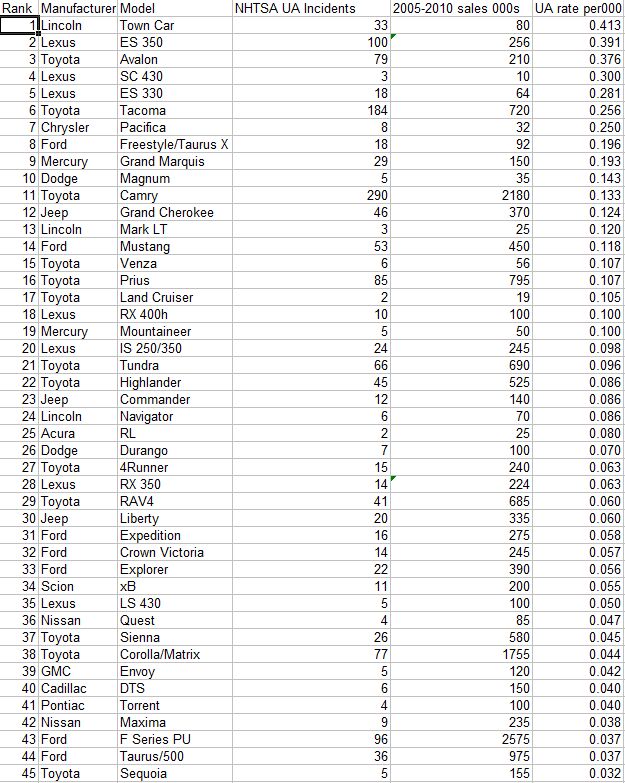
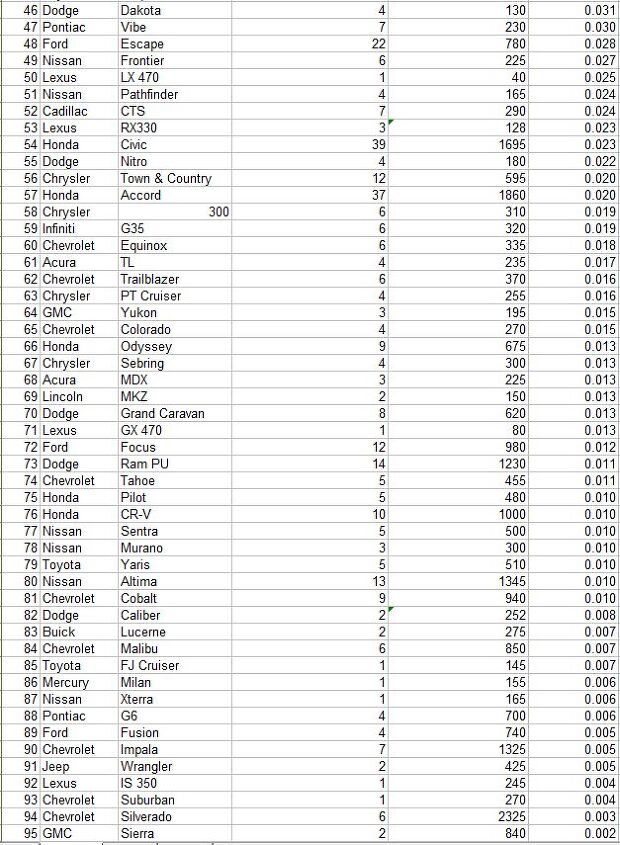
Numbers and statistics are largely useless without context. Edmunds.com took a first good step in going through NHTSA’s data base and reporting the number of UA events reported per make, brand and vehicle. But what was obviously missing was the correlation to the number of cars on the road in relation to those numbers. We’ve taken the next (tedious) step, and the results are most interesting indeed. They’re certainly not completely conclusive, but we’re not finished yet. The full list of 95 cars follows, as well as our methodology, a stab at some analysis, and more questions to still be answered.
First, our methodology. Edmund’s NHTSA data was for model year 2005 – 2010 cars, to date. Lacking easy complete sales data, I’ve taken the 2008 MY sales for these vehicles, and multiplied by five to arrive at a working number. If detailed sales numbers are to be found, I will update them. But I doubt it would change the numbers significantly.
Obviously, the cars that had lower numbers of events reported are going to be statistically less reliable. And unless we go back to the NHTSA and mine the original data, if that level is available, we don’t know what type of UA event was reported. Was it a likely wrong pedal application, which typically happens at low speeds and often in parking lots (hopefully not near a cliff)? Did it come on after merging into a freeway? Having that level of detail would allow us to make further assumptions, especially if certain cars had higher incidents of a particular type of UA event.
The other thing is consider whether the given vehicle had brake override or not. On the one hand, it’s interesting to note that no European brands were reported, and they pretty much all have brake override. But then so does Chrysler, and several of their cars, especially certain Jeep models, had fairly high rates of reported UA.
There are other factors to consider, like the demographics and use of the specific vehicles. I suspect strongly that the Lincoln TC, the Grand Marquis and the Crown Vic all have the same mechanical and electronic systems. Yet the TC came in the Marquis but the Crown Vic at Is the high proportion of CV use in taxi and police service an issue here? And what are the TC and Marquis owners’ median age?
So many questions and so few answers: Ford, which does not have brake override, had some models fairly high on the list, but the popular Fusion was very low with a rate of .005, and its sibling Milan with a .006. The fact that these virtually identical cars came in so closely gives support to these statistics being reasonably accurate. Other examples are GMC Sierra and Chevrolet Silverado at # 95 and And the Malibu and similar G6 are at #84 and But then when it gets down to such few reported events, randomness increasingly becomes a factor.
GM’s low UA rate is undeniable: their highest car is the Cadillac DTS, at It also has a notoriously high median age of its owners. The mechanically related Lucerne and Impala are not far apart, with the Lucerne being somewhat higher and undoubtedly having an older median age of its owners. I’m conjecturing here, but the numbers tend to bear it out.
Clearly, Toyota vehicles are skewing to the upper end of the range, although the Corolla/Matrix is down at And the Yaris is very low on the list at What exactly puts the Lexus ES 350 at such a high rate is certainly worth exploring, especially since it was involved in the two must publicized UA events. Its general mechanical similarity to the Camry is well known; without breaking out the types of events the ES 350/330 has been involved with, its difficult to say. But additional information would be indicative, since the Camry is not all that high on the list at Are Lexus floor mats thicker and deeper than the Camry’s? Are the electronics substantially different? Are Camrys imported from Japan involved at higher rates? ( all Lexus ES models are also imported).
The questions go on and on. I will continue the quest of turning up statistics that shed further light on this issue. And your comments , analysis and questions will be most appreciated and helpful. One thing: keep in mind that these are only those cars that had UA incidents reported to the NHTSA (actually, I removed a few out-of production cars from the list). Missing of course are all those cars with no reported incidents, including whole brands, like Hyundai, Kia, Mazda, Subaru, Volvo, and all the Europeans (except Saab). Did I miss someone significant? Full list follows:

More by Paul Niedermeyer


Comments
Join the conversation
Town Car and Grand Marquis sales are understated quite a bit in the table, due to Paul using only 2008 sales. Ford closed Wixom Assembly in the middle of 2007, where the Town Car was built, and then added it to the St. Thomas plant where the Crown Vic and Grand Marquis were built. At that time, Ford also stopped pushing Town Car and Grand Marquis at retail, so sales fell considerably for both products in 2008. By using only 2008 sales data, this has the effect of understating sales by a lot, and therefore, overstating the rate of SUA for Town Car and Grand Marquis. Sales drop from 2005 to 2008 for Town Car was 47K in 2005 to 16K in 2008 -- Grand Marquis was a little less, but large as well. Crown Vic was, and is, primarily sold to fleets, and sales have been somewhat steady over the 5 years (especially relative to the rest of the industry), so it's position in Paul's table is probably more accurate.
I didn't see this anywhere. Were the sales numbers proportionally adjusted for older sales being on the road longer to have more complaints?